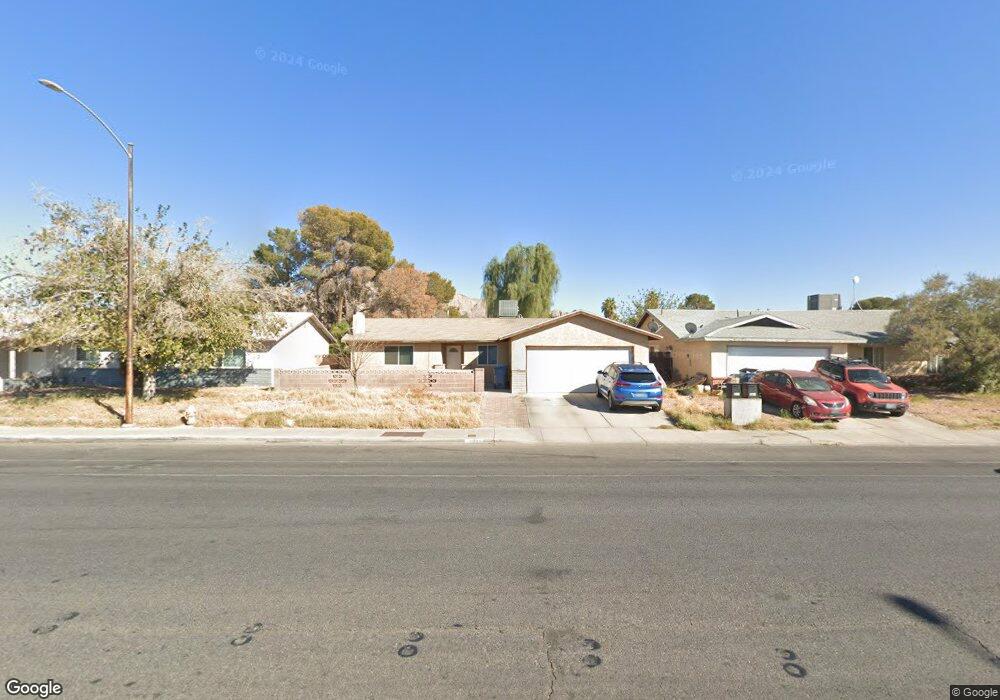
370 N Christy Ln Las Vegas, NV 89110
Estimated Value: $316,000 - $377,000
3
Beds
2
Baths
1,388
Sq Ft
$254/Sq Ft
Est. Value
About This Home
This home is located at 370 N Christy Ln, Las Vegas, NV 89110 and is currently estimated at $353,036, approximately $254 per square foot. 370 N Christy Ln is a home located in Clark County with nearby schools including Richard J. Rundle Elementary School, Charlotte & Jerry Keller Elementary School, and Duane D. Keller Middle School.
Ownership History
Date
Name
Owned For
Owner Type
Purchase Details
Closed on
Apr 25, 2006
Sold by
Smith Heather N
Bought by
Smith Michael E
Current Estimated Value
Home Financials for this Owner
Home Financials are based on the most recent Mortgage that was taken out on this home.
Original Mortgage
$150,000
Outstanding Balance
$86,326
Interest Rate
6.29%
Mortgage Type
Fannie Mae Freddie Mac
Estimated Equity
$266,710
Purchase Details
Closed on
Sep 25, 2003
Sold by
Smith Michael E
Bought by
Smith Michael E and Smith Heather N
Home Financials for this Owner
Home Financials are based on the most recent Mortgage that was taken out on this home.
Original Mortgage
$68,386
Interest Rate
6.22%
Mortgage Type
Unknown
Purchase Details
Closed on
Apr 1, 1994
Sold by
Yamamoto George Toshiaki
Bought by
Smith Michael E
Home Financials for this Owner
Home Financials are based on the most recent Mortgage that was taken out on this home.
Original Mortgage
$74,000
Interest Rate
7.38%
Create a Home Valuation Report for This Property
The Home Valuation Report is an in-depth analysis detailing your home's value as well as a comparison with similar homes in the area
Home Values in the Area
Average Home Value in this Area
Purchase History
| Date | Buyer | Sale Price | Title Company |
|---|---|---|---|
| Smith Michael E | -- | Equity Title Of Nevada | |
| Smith Michael E | -- | First American Title Company | |
| Smith Michael E | $78,000 | United Title |
Source: Public Records
Mortgage History
| Date | Status | Borrower | Loan Amount |
|---|---|---|---|
| Open | Smith Michael E | $150,000 | |
| Closed | Smith Michael E | $68,386 | |
| Closed | Smith Michael E | $74,000 |
Source: Public Records
Tax History Compared to Growth
Tax History
| Year | Tax Paid | Tax Assessment Tax Assessment Total Assessment is a certain percentage of the fair market value that is determined by local assessors to be the total taxable value of land and additions on the property. | Land | Improvement |
|---|---|---|---|---|
| 2025 | $957 | $53,155 | $27,300 | $25,855 |
| 2024 | $886 | $53,155 | $27,300 | $25,855 |
| 2023 | $886 | $53,555 | $28,000 | $25,555 |
| 2022 | $821 | $46,138 | $22,400 | $23,738 |
| 2021 | $760 | $43,991 | $21,000 | $22,991 |
| 2020 | $703 | $43,503 | $20,300 | $23,203 |
| 2019 | $659 | $38,681 | $15,400 | $23,281 |
| 2018 | $629 | $35,938 | $13,300 | $22,638 |
| 2017 | $1,030 | $35,109 | $11,900 | $23,209 |
| 2016 | $590 | $31,982 | $8,050 | $23,932 |
| 2015 | $588 | $28,352 | $5,600 | $22,752 |
| 2014 | $569 | $18,829 | $4,550 | $14,279 |
Source: Public Records
Map
Nearby Homes
- 360 Sir Richard Dr E
- 332 Sir Jeffery Cir
- 280 Sir Phillip St
- 522 Wheaties Way
- 147 N Christy Ln
- 5529 Cedar Ave
- 316 Linn Ln
- 5364 Awbury Ave
- 656 N Christy Ln
- 262 Solicito St
- 179 Sir George Dr
- 5564 Orchard Ln Unit 133
- 5854 Heather Marie Dr
- 5583 Orchard Ln Unit 152
- 153 Sir Thomas Dr
- 136 Sir George Dr
- 5275 Hagemann Ln
- 5600 Orchard Ln
- 730 N Christy Ln
- 266 Lyra Ln
- 360 N Christy Ln
- 380 N Christy Ln
- 380 N Christy Ln Unit na
- 371 Bergin Dr
- 361 Bergin Dr
- 381 Bergin Dr
- 350 N Christy Ln
- 390 N Christy Ln
- 351 Bergin Dr
- 380 Sir Richard Cir
- 340 N Christy Ln
- 5510 Reuben St
- 341 Bergin Dr
- 5482 Sir Richard Cir
- 372 Bergin Dr
- 330 N Christy Ln
- 362 Bergin Dr
- 5520 Reuben St
- 331 Bergin Dr
- 352 Bergin Dr