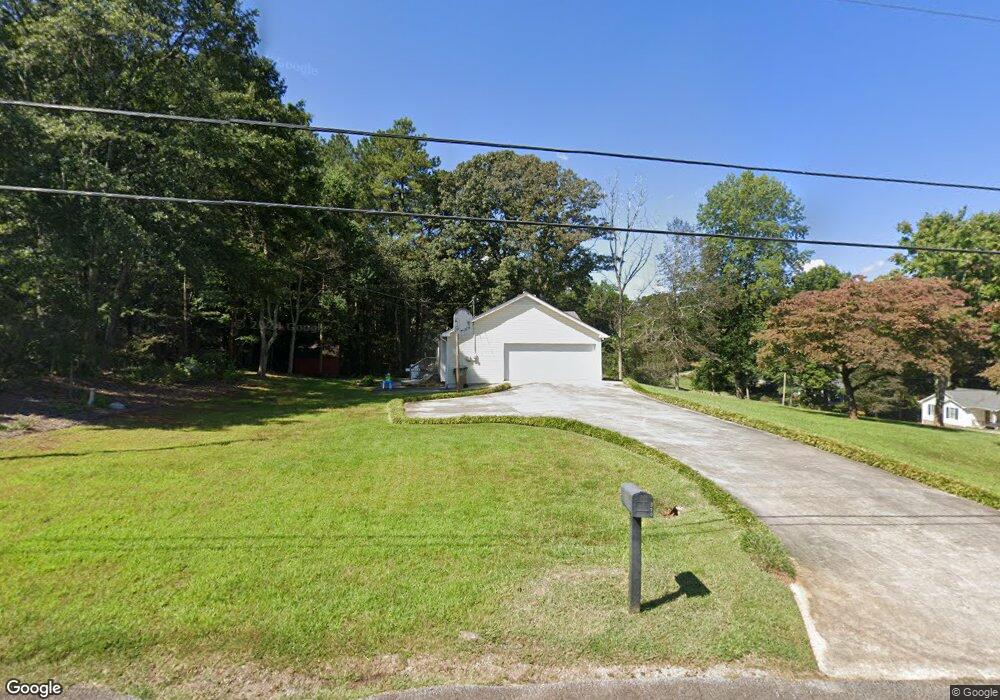
370 Ridgeview Dr Unit 3 Auburn, GA 30011
Estimated Value: $299,000 - $345,492
3
Beds
2
Baths
1,446
Sq Ft
$223/Sq Ft
Est. Value
About This Home
This home is located at 370 Ridgeview Dr Unit 3, Auburn, GA 30011 and is currently estimated at $322,623, approximately $223 per square foot. 370 Ridgeview Dr Unit 3 is a home located in Barrow County with nearby schools including Auburn Elementary School, Westside Middle School, and Apalachee High School.
Ownership History
Date
Name
Owned For
Owner Type
Purchase Details
Closed on
Sep 29, 2022
Sold by
Jones Michael
Bought by
Pierce Preston and Pierce Macy
Current Estimated Value
Home Financials for this Owner
Home Financials are based on the most recent Mortgage that was taken out on this home.
Original Mortgage
$300,000
Outstanding Balance
$287,907
Interest Rate
5.66%
Mortgage Type
New Conventional
Estimated Equity
$34,716
Purchase Details
Closed on
Feb 5, 2008
Sold by
Hasty Elinor D
Bought by
Jones Michael and Stokes Brittany
Home Financials for this Owner
Home Financials are based on the most recent Mortgage that was taken out on this home.
Original Mortgage
$120,557
Interest Rate
6.17%
Mortgage Type
FHA
Purchase Details
Closed on
Jun 16, 1998
Sold by
Hasty Elinor D
Bought by
Hasty Elinor D
Purchase Details
Closed on
May 21, 1998
Sold by
Hasty John G and Hasty Elino
Bought by
Hasty Elinor D
Purchase Details
Closed on
Jul 28, 1987
Bought by
Hasty John G and Hasty Elino
Create a Home Valuation Report for This Property
The Home Valuation Report is an in-depth analysis detailing your home's value as well as a comparison with similar homes in the area
Home Values in the Area
Average Home Value in this Area
Purchase History
| Date | Buyer | Sale Price | Title Company |
|---|---|---|---|
| Pierce Preston | $300,000 | -- | |
| Jones Michael | $122,500 | -- | |
| Hasty Elinor D | -- | -- | |
| Hasty Elinor D | -- | -- | |
| Hasty John G | $68,500 | -- |
Source: Public Records
Mortgage History
| Date | Status | Borrower | Loan Amount |
|---|---|---|---|
| Open | Pierce Preston | $300,000 | |
| Previous Owner | Jones Michael | $120,557 |
Source: Public Records
Tax History Compared to Growth
Tax History
| Year | Tax Paid | Tax Assessment Tax Assessment Total Assessment is a certain percentage of the fair market value that is determined by local assessors to be the total taxable value of land and additions on the property. | Land | Improvement |
|---|---|---|---|---|
| 2024 | $2,738 | $114,259 | $24,000 | $90,259 |
| 2023 | $2,807 | $114,659 | $24,000 | $90,659 |
| 2022 | $1,882 | $78,760 | $18,000 | $60,760 |
| 2021 | $1,516 | $53,121 | $12,000 | $41,121 |
| 2020 | $1,476 | $51,718 | $12,000 | $39,718 |
| 2019 | $1,458 | $50,316 | $12,000 | $38,316 |
| 2018 | $1,266 | $44,704 | $12,000 | $32,704 |
| 2017 | $1,020 | $35,036 | $12,000 | $23,036 |
| 2016 | $843 | $31,682 | $8,000 | $23,682 |
| 2015 | $856 | $32,004 | $8,000 | $24,004 |
| 2014 | $788 | $29,815 | $5,488 | $24,327 |
| 2013 | -- | $28,743 | $5,488 | $23,255 |
Source: Public Records
Map
Nearby Homes
- 502 Eagles Nest Cir
- 522 Eagles Nest Cir
- 433 Mount Moriah Rd
- 359 Scenic Ln
- 5899 Wheeler Ridge Rd
- 173 Deer Wood Dr
- 494 Courtney Ln Unit 2
- 1380 Cronic Town Rd
- 491 Glen Terrace Rd
- 1587 Cronic Town Rd Unit 1
- 1329 Harmony Grove Church Rd
- 345 Etheridge Rd
- 4363 Saddlecreek Ct
- 4293 Saddlecreek Ct
- 60 Wood Chuck Ct
- 70 Wood Chuck Ct
- 1923 Westfall Landing
- 280 Etheridge Rd
- 370 Ridgeview Dr
- 368 Ridgeview Dr
- 1504 Country Ct Unit 3
- 1507 Country Ct Unit 3
- 393 Mount Moriah Rd
- 1501 Country Ct
- 0 Country Ct Unit 7020058
- 0 Country Ct Unit 9063425
- 0 Country Ct Unit 3034404
- 0 Country Ct Unit 8059026
- 1508 Country Ct
- 1508 Country Ct Unit 3
- 1502 Country Ct
- 367 Ridgeview Dr
- 389 Mount Moriah Rd
- 364 Ridgeview Dr Unit 3
- 1510 Country Ct Unit 3
- 1509 Country Ct
- 365 Ridgeview Dr
- 385 Mount Moriah Rd