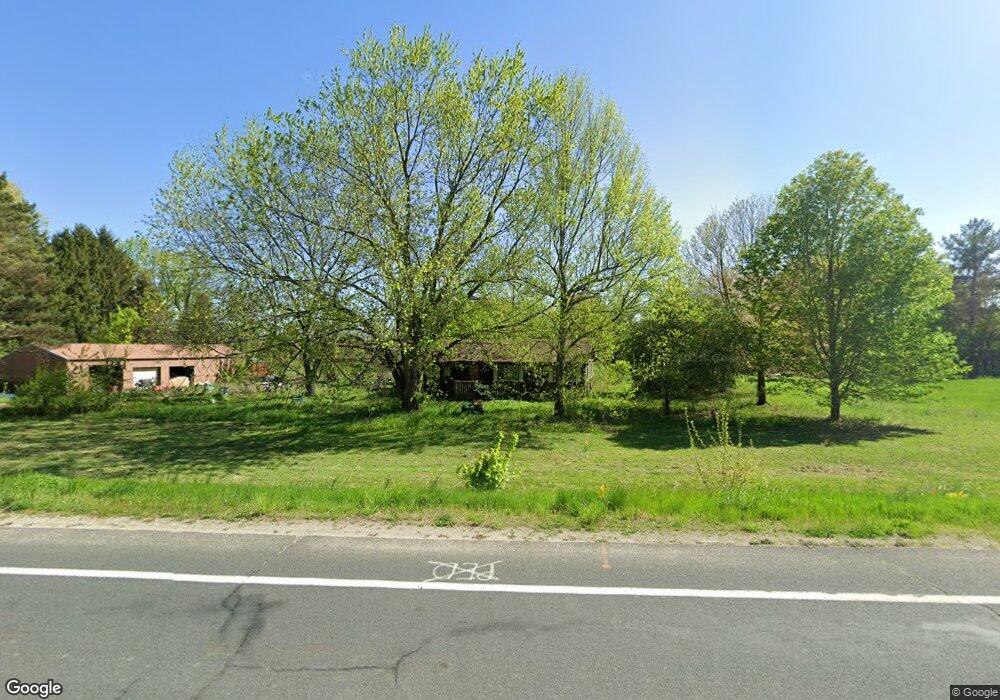
370 Riverview Dr Plainwell, MI 49080
Estimated Value: $245,028 - $311,000
3
Beds
1
Bath
1,440
Sq Ft
$189/Sq Ft
Est. Value
About This Home
This home is located at 370 Riverview Dr, Plainwell, MI 49080 and is currently estimated at $272,007, approximately $188 per square foot. 370 Riverview Dr is a home located in Allegan County with nearby schools including Plainwell High School.
Ownership History
Date
Name
Owned For
Owner Type
Purchase Details
Closed on
Nov 1, 2022
Sold by
Cobb Joshua M
Bought by
Abundant Life Homes Llc
Current Estimated Value
Purchase Details
Closed on
Oct 27, 2011
Sold by
Secretary Of Housing & Urban Development
Bought by
Cobb Joshua M
Home Financials for this Owner
Home Financials are based on the most recent Mortgage that was taken out on this home.
Original Mortgage
$81,632
Interest Rate
4.09%
Mortgage Type
New Conventional
Purchase Details
Closed on
Sep 4, 2011
Sold by
Chase Home Finance Llc
Bought by
Secretary Of Housing & Urban Development
Home Financials for this Owner
Home Financials are based on the most recent Mortgage that was taken out on this home.
Original Mortgage
$81,632
Interest Rate
4.09%
Mortgage Type
New Conventional
Purchase Details
Closed on
May 20, 2010
Sold by
Carpenter Gregory N and Carpenter Debra K
Bought by
Chase Home Finance Llc
Create a Home Valuation Report for This Property
The Home Valuation Report is an in-depth analysis detailing your home's value as well as a comparison with similar homes in the area
Home Values in the Area
Average Home Value in this Area
Purchase History
| Date | Buyer | Sale Price | Title Company |
|---|---|---|---|
| Abundant Life Homes Llc | $6,000 | -- | |
| Cobb Joshua M | $80,000 | Devon Otsego | |
| Secretary Of Housing & Urban Development | -- | None Available | |
| Chase Home Finance Llc | $172,861 | None Available |
Source: Public Records
Mortgage History
| Date | Status | Borrower | Loan Amount |
|---|---|---|---|
| Previous Owner | Cobb Joshua M | $81,632 |
Source: Public Records
Tax History
| Year | Tax Paid | Tax Assessment Tax Assessment Total Assessment is a certain percentage of the fair market value that is determined by local assessors to be the total taxable value of land and additions on the property. | Land | Improvement |
|---|---|---|---|---|
| 2025 | $4,990 | $98,600 | $29,700 | $68,900 |
| 2024 | $2,078 | $92,300 | $24,300 | $68,000 |
| 2023 | $2,459 | $90,900 | $23,300 | $67,600 |
| 2022 | $2,078 | $80,500 | $21,600 | $58,900 |
| 2020 | $1,940 | $80,900 | $10,200 | $70,700 |
| 2019 | $0 | $79,000 | $10,200 | $68,800 |
| 2018 | $0 | $65,000 | $10,200 | $54,800 |
| 2017 | $0 | $65,400 | $10,200 | $55,200 |
| 2016 | $0 | $58,500 | $15,300 | $43,200 |
| 2015 | -- | $58,500 | $15,300 | $43,200 |
| 2014 | -- | $58,500 | $15,300 | $43,200 |
| 2013 | -- | $55,100 | $15,300 | $39,800 |
Source: Public Records
Map
Nearby Homes
- 10466 N Riverview Dr
- 3165 Elk Antler Ave Unit 1
- 3127 Elk Antler Ave Unit 2
- 200 Golf View Dr
- 2350 E B Ave
- 3041 Elk Antler Ave
- 575 Rushing Dr
- 3166 Elk Antler Ave Unit 8
- 337 Horseshoe Ct
- 2824 E B Ave
- 247 Deer Run Blvd
- 15313 Doster Rd
- VL Doster Road Lot#wp001
- 282 Doster Rd
- VL Douglas Ave
- 24 Heron Ct
- 9585 Douglas Ave
- 721 E Bridge St
- 936 James St
- 605 Marsh Rd
- 382 Riverview Dr
- 365 Riverview Dr
- 363 Riverview Dr
- 379 Riverview Dr
- 353 Riverview Dr
- 392 Dorothy St
- 360 Riverview Dr
- 386 Riverview Dr
- 346 Riverview Dr
- 388 Dorothy St
- 347 Riverview Dr
- 384 Dorothy St
- 384 Dorothy St
- 397 Dorothy St
- 393 Dorothy St
- 392 Riverview Dr
- 380 Dorothy St
- 393 Riverview Dr
- 390 Kenneth Dr
- 376 Dorothy St
Your Personal Tour Guide
Ask me questions while you tour the home.