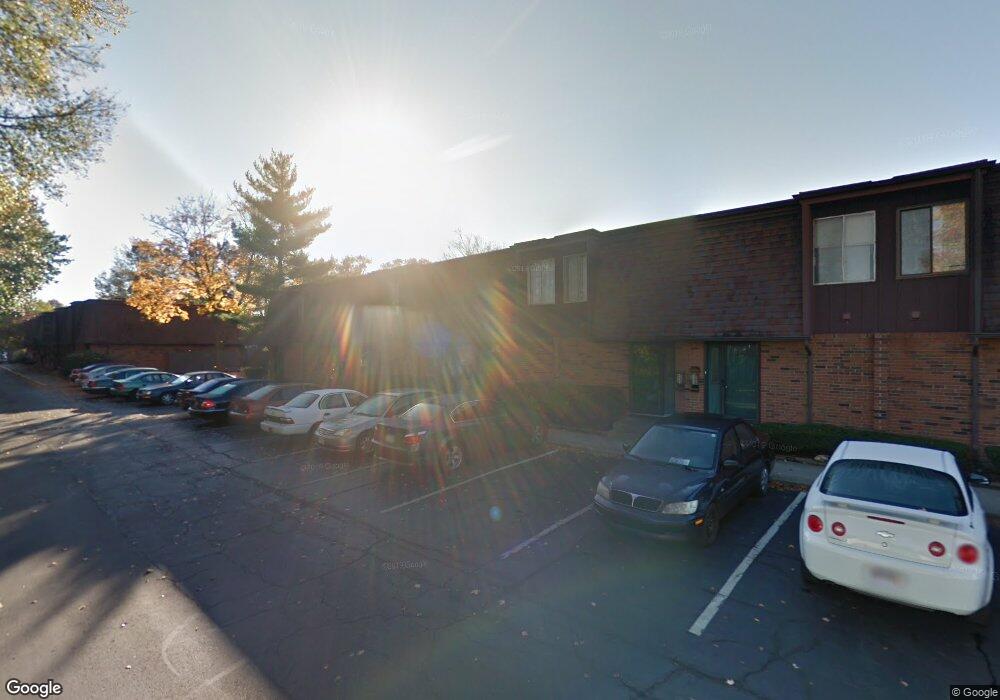
370 Shell Ct W Unit 370 Columbus, OH 43213
Estimated Value: $124,000 - $176,000
2
Beds
2
Baths
952
Sq Ft
$158/Sq Ft
Est. Value
About This Home
This home is located at 370 Shell Ct W Unit 370, Columbus, OH 43213 and is currently estimated at $150,405, approximately $157 per square foot. 370 Shell Ct W Unit 370 is a home located in Franklin County with nearby schools including Etna Road Elementary School, Beechwood Elementary School, and Rosemore Middle School.
Ownership History
Date
Name
Owned For
Owner Type
Purchase Details
Closed on
Oct 11, 2022
Sold by
Foxfire Village Condominium Association
Bought by
Johnson Kelli Elaine
Current Estimated Value
Home Financials for this Owner
Home Financials are based on the most recent Mortgage that was taken out on this home.
Original Mortgage
$112,917
Outstanding Balance
$108,107
Interest Rate
6.02%
Mortgage Type
FHA
Estimated Equity
$42,298
Purchase Details
Closed on
Feb 7, 2005
Sold by
Rowley Rosemary E and State Street Bank
Bought by
Foxfire Village Condominium Assn
Purchase Details
Closed on
Oct 19, 1995
Sold by
Ramey Donald E
Bought by
Rosemary E Rowley
Home Financials for this Owner
Home Financials are based on the most recent Mortgage that was taken out on this home.
Original Mortgage
$31,500
Interest Rate
7.68%
Mortgage Type
New Conventional
Create a Home Valuation Report for This Property
The Home Valuation Report is an in-depth analysis detailing your home's value as well as a comparison with similar homes in the area
Home Values in the Area
Average Home Value in this Area
Purchase History
| Date | Buyer | Sale Price | Title Company |
|---|---|---|---|
| Johnson Kelli Elaine | $115,000 | Valmer Land Title | |
| Foxfire Village Condominium Assn | $37,000 | -- | |
| Rosemary E Rowley | $31,900 | -- |
Source: Public Records
Mortgage History
| Date | Status | Borrower | Loan Amount |
|---|---|---|---|
| Open | Johnson Kelli Elaine | $112,917 | |
| Previous Owner | Rosemary E Rowley | $31,500 | |
| Closed | Johnson Kelli Elaine | $5,750 |
Source: Public Records
Tax History
| Year | Tax Paid | Tax Assessment Tax Assessment Total Assessment is a certain percentage of the fair market value that is determined by local assessors to be the total taxable value of land and additions on the property. | Land | Improvement |
|---|---|---|---|---|
| 2025 | $1,237 | $28,290 | $5,780 | $22,510 |
| 2024 | $1,237 | $28,290 | $5,780 | $22,510 |
| 2023 | $1,228 | $28,290 | $5,780 | $22,510 |
| 2022 | $981 | $16,770 | $1,890 | $14,880 |
| 2021 | $923 | $16,770 | $1,890 | $14,880 |
| 2020 | $914 | $16,770 | $1,890 | $14,880 |
| 2019 | $779 | $12,430 | $1,400 | $11,030 |
| 2018 | $684 | $12,430 | $1,400 | $11,030 |
| 2017 | $662 | $12,430 | $1,400 | $11,030 |
| 2016 | $570 | $7,740 | $2,210 | $5,530 |
| 2015 | $574 | $7,740 | $2,210 | $5,530 |
| 2014 | $525 | $7,740 | $2,210 | $5,530 |
| 2013 | $293 | $9,100 | $2,590 | $6,510 |
Source: Public Records
Map
Nearby Homes
- 431 Cumberland Dr
- 4481 Chandler Dr
- 547 Country Club Rd
- 4517 Saint Rita Ln
- 4662 Jae Ave
- 491 Westphal Ave
- 4413 Broadhurst Dr
- 706 Ross Rd
- 845 Exeter Rd
- 695 Erickson Ave
- 745 Pierce Ave
- 4212 Seigman Ave
- 686 Fairway Blvd
- 4148 Elbern Ave
- 931 Antwerp Rd
- 4117 Elbern Ave
- 4105 Elbern Ave
- 798 S Yearling Rd
- 1085 S Hamilton Rd
- 4174 Wright Park
- 372 Shell Ct W Unit 372
- 374 Shell Ct W
- 376 Shell Ct W
- 378 Shell Ct W Unit C378
- 375 Shell Ct E Unit 375A
- 4765 Shell Ct N Unit A4765
- 4769 Shell Ct N Unit A4769
- 4763 Shell Ct N Unit A4763
- 4767 Shell Ct N Unit 4767
- 380 Shell Ct W Unit C380
- 373 Shell Ct E
- 377 Shell Ct E Unit M377
- 371 Shell Ct E
- 381 Shell Ct E Unit M381
- 382 Shell Ct W Unit C382
- 4761 Shell Ct N Unit A4761
- 383 Shell Ct E
- 4759 Shell Ct N
- 384 Shell Ct W Unit C384
- 385 Shell Ct E
Your Personal Tour Guide
Ask me questions while you tour the home.