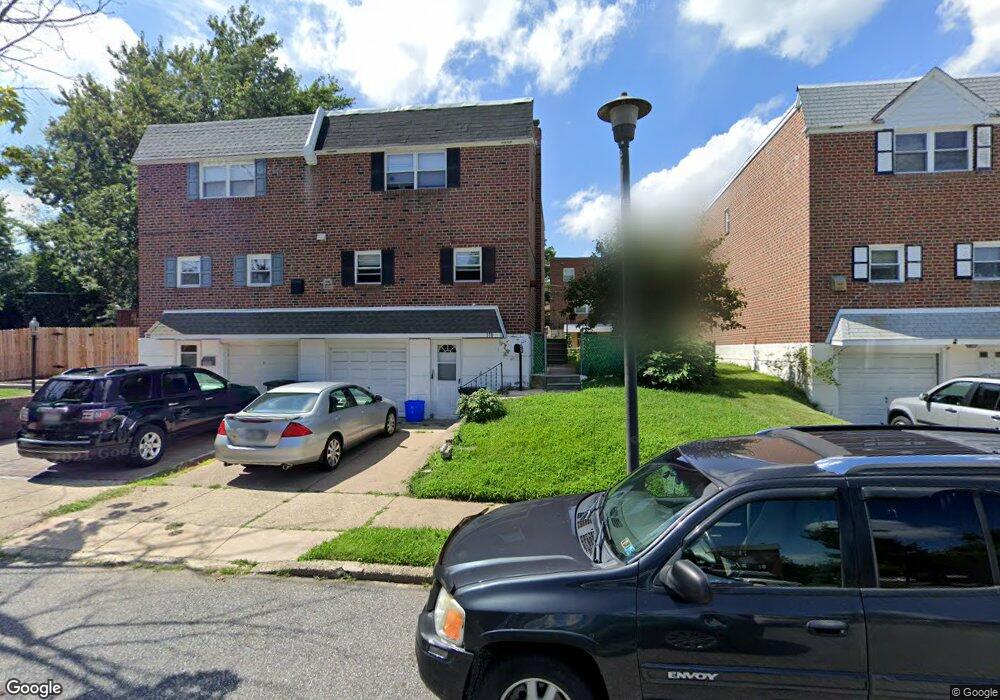
370 Tomlinson Place Philadelphia, PA 19116
Somerton NeighborhoodEstimated Value: $398,140 - $431,000
4
Beds
3
Baths
1,732
Sq Ft
$242/Sq Ft
Est. Value
About This Home
This home is located at 370 Tomlinson Place, Philadelphia, PA 19116 and is currently estimated at $418,285, approximately $241 per square foot. 370 Tomlinson Place is a home located in Philadelphia County with nearby schools including Loesche William H School, CCA Baldi Middle School, and George Washington High School.
Ownership History
Date
Name
Owned For
Owner Type
Purchase Details
Closed on
Aug 9, 2023
Sold by
Ni Mu Hong and Wong Chung Sum
Bought by
Wong Eric Sum
Current Estimated Value
Purchase Details
Closed on
Oct 27, 2015
Sold by
Fannie Mae
Bought by
Ni Mu Hong and Wong Chung Sum
Purchase Details
Closed on
Apr 16, 2015
Sold by
Bank Of America Na
Bought by
Federal National Mortgage Association
Purchase Details
Closed on
Dec 5, 2014
Sold by
Gereaghty Michael
Bought by
Bank Of America Na
Purchase Details
Closed on
Mar 9, 2007
Sold by
Chen Bo Zong and Zeng Qing Xiu
Bought by
Gereaghty Michael
Home Financials for this Owner
Home Financials are based on the most recent Mortgage that was taken out on this home.
Original Mortgage
$245,000
Interest Rate
6.4%
Mortgage Type
Purchase Money Mortgage
Purchase Details
Closed on
Mar 31, 1997
Sold by
Keselman Michael and Keselman Svetlana
Bought by
Chen Bo Zong and Zeng Qing Xiu
Create a Home Valuation Report for This Property
The Home Valuation Report is an in-depth analysis detailing your home's value as well as a comparison with similar homes in the area
Home Values in the Area
Average Home Value in this Area
Purchase History
| Date | Buyer | Sale Price | Title Company |
|---|---|---|---|
| Wong Eric Sum | -- | None Listed On Document | |
| Ni Mu Hong | $170,000 | None Available | |
| Federal National Mortgage Association | -- | Attorney | |
| Bank Of America Na | $16,800 | None Available | |
| Gereaghty Michael | $245,000 | None Available | |
| Chen Bo Zong | $108,000 | -- |
Source: Public Records
Mortgage History
| Date | Status | Borrower | Loan Amount |
|---|---|---|---|
| Previous Owner | Gereaghty Michael | $245,000 |
Source: Public Records
Tax History Compared to Growth
Tax History
| Year | Tax Paid | Tax Assessment Tax Assessment Total Assessment is a certain percentage of the fair market value that is determined by local assessors to be the total taxable value of land and additions on the property. | Land | Improvement |
|---|---|---|---|---|
| 2026 | $3,995 | $363,800 | $72,760 | $291,040 |
| 2025 | $3,995 | $363,800 | $72,760 | $291,040 |
| 2024 | $3,995 | $363,800 | $72,760 | $291,040 |
| 2023 | $3,995 | $285,400 | $57,080 | $228,320 |
| 2022 | $3,355 | $285,400 | $57,080 | $228,320 |
| 2021 | $3,355 | $0 | $0 | $0 |
| 2020 | $3,355 | $0 | $0 | $0 |
| 2019 | $3,159 | $0 | $0 | $0 |
| 2018 | $2,923 | $0 | $0 | $0 |
| 2017 | $2,923 | $0 | $0 | $0 |
| 2016 | $2,923 | $0 | $0 | $0 |
| 2015 | -- | $0 | $0 | $0 |
| 2014 | -- | $208,800 | $74,241 | $134,559 |
| 2012 | -- | $27,424 | $3,618 | $23,806 |
Source: Public Records
Map
Nearby Homes
- 375 Avon St
- 412 Avon Place
- 10665 Halstead St
- 11012 Audubon Ave
- 133 Gardner St
- 441 Tomlinson Rd Unit F6
- 11022 Ferndale St
- 370 Selma St
- 10922 Lockart Rd
- 118 Rennard Place
- 115 Gardner St
- 10752 Jeanes St
- 166 Rennard St
- 509 Larkspur St
- 226 Lockart Terrace
- 11990 Rennard St
- 11715 Jeanes St
- 11722 Audubon Ave
- 228 Erica St
- 728 Kentwood St
- 372 Tomlinson Place
- 368 Tomlinson Place
- 362 Tomlinson Terrace
- 364 Tomlinson Terrace
- 366 Tomlinson Terrace
- 374 Tomlinson Place
- 360 Tomlinson Terrace
- 376 Tomlinson Place
- 369 Helene Place
- 378 Tomlinson Place
- 371 Helene Place
- 367 Kevin Ct
- 382 Tomlinson Place
- 365 Kevin Ct
- 384 Tomlinson Place
- 380 Tomlinson Place
- 386 Tomlinson Place
- 345 Avon St
- 343 Avon St
- 349 Avon St