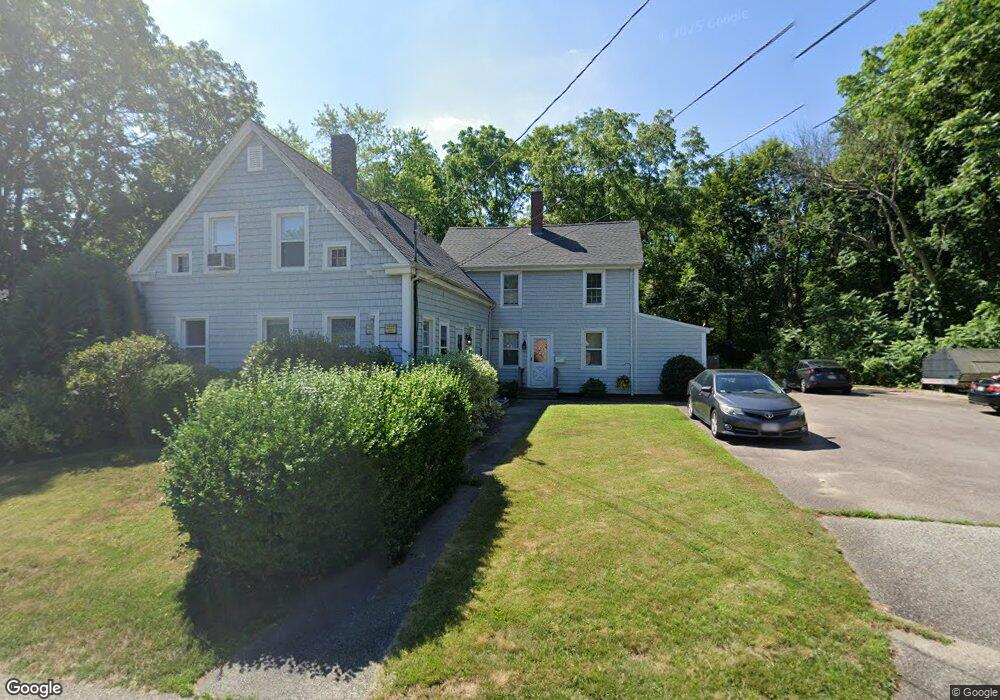
370 W Union St East Bridgewater, MA 02333
Estimated Value: $505,358 - $674,000
5
Beds
3
Baths
2,220
Sq Ft
$280/Sq Ft
Est. Value
About This Home
This home is located at 370 W Union St, East Bridgewater, MA 02333 and is currently estimated at $620,590, approximately $279 per square foot. 370 W Union St is a home located in Plymouth County with nearby schools including Central Elementary School, Gordon W Mitchell Middle School, and East Bridgewater Jr./Sr. High School.
Ownership History
Date
Name
Owned For
Owner Type
Purchase Details
Closed on
Jul 19, 2022
Sold by
Butler Steven M
Bought by
Butler Steven M and Brown Eleanor M
Current Estimated Value
Home Financials for this Owner
Home Financials are based on the most recent Mortgage that was taken out on this home.
Original Mortgage
$325,000
Outstanding Balance
$311,041
Interest Rate
5.81%
Mortgage Type
Stand Alone Refi Refinance Of Original Loan
Estimated Equity
$309,549
Purchase Details
Closed on
Jan 29, 1999
Sold by
Forni Bros Oil Inc
Bought by
Butler Steven M
Home Financials for this Owner
Home Financials are based on the most recent Mortgage that was taken out on this home.
Original Mortgage
$151,905
Interest Rate
6.67%
Mortgage Type
Purchase Money Mortgage
Create a Home Valuation Report for This Property
The Home Valuation Report is an in-depth analysis detailing your home's value as well as a comparison with similar homes in the area
Home Values in the Area
Average Home Value in this Area
Purchase History
| Date | Buyer | Sale Price | Title Company |
|---|---|---|---|
| Butler Steven M | -- | None Available | |
| Butler Steven M | -- | None Available | |
| Butler Steven M | $159,900 | -- | |
| Butler Steven M | $159,900 | -- |
Source: Public Records
Mortgage History
| Date | Status | Borrower | Loan Amount |
|---|---|---|---|
| Open | Butler Steven M | $325,000 | |
| Closed | Butler Steven M | $325,000 | |
| Previous Owner | Butler Steven M | $71,000 | |
| Previous Owner | Butler Steven M | $150,000 | |
| Previous Owner | Butler Steven M | $151,905 |
Source: Public Records
Tax History Compared to Growth
Tax History
| Year | Tax Paid | Tax Assessment Tax Assessment Total Assessment is a certain percentage of the fair market value that is determined by local assessors to be the total taxable value of land and additions on the property. | Land | Improvement |
|---|---|---|---|---|
| 2025 | $5,091 | $372,400 | $182,700 | $189,700 |
| 2024 | $5,083 | $367,300 | $175,700 | $191,600 |
| 2023 | $5,134 | $355,300 | $175,700 | $179,600 |
| 2022 | $5,267 | $337,600 | $159,800 | $177,800 |
| 2021 | $5,147 | $301,900 | $153,500 | $148,400 |
| 2020 | $5,170 | $299,000 | $147,600 | $151,400 |
| 2019 | $4,996 | $284,500 | $141,100 | $143,400 |
| 2018 | $4,840 | $269,500 | $141,100 | $128,400 |
| 2017 | $4,742 | $259,100 | $134,500 | $124,600 |
| 2016 | $4,631 | $255,000 | $134,500 | $120,500 |
| 2015 | $4,509 | $253,900 | $133,600 | $120,300 |
| 2014 | $4,407 | $253,700 | $130,800 | $122,900 |
Source: Public Records
Map
Nearby Homes
- 407 W Union St
- 505 N Central St
- 282 Spring St
- 11 Willow Ave
- 223 Laurel St
- 451 West St
- 41 Bedford St
- 495 E Center St
- 386 Matfield St
- 50 Belmont St
- 590 Bedford St
- 71 Church St
- 11 Harmony Crossing
- 446 Elm St
- 261 Plymouth St
- 416 Highland St
- 52 Cottage St
- 455 Plymouth St
- 54 Michael Rd Unit 33
- 201 Comfort St