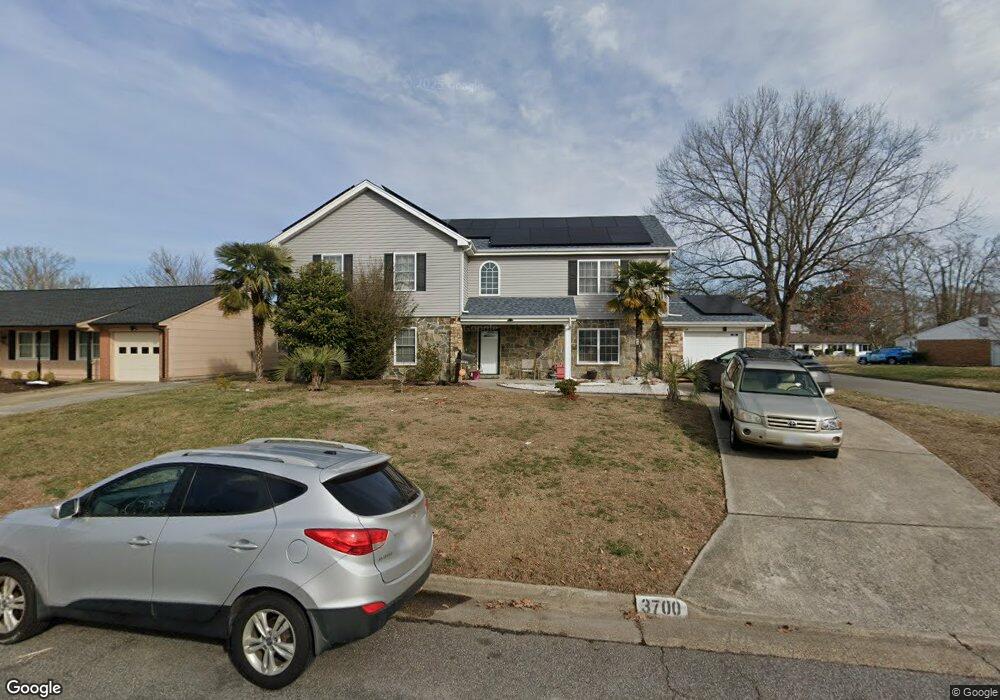
3700 Appalachian Ct Virginia Beach, VA 23452
Larkspur NeighborhoodEstimated Value: $490,267 - $528,000
6
Beds
4
Baths
2,818
Sq Ft
$178/Sq Ft
Est. Value
About This Home
This home is located at 3700 Appalachian Ct, Virginia Beach, VA 23452 and is currently estimated at $502,567, approximately $178 per square foot. 3700 Appalachian Ct is a home located in Virginia Beach City with nearby schools including Windsor Woods Elementary School, Independence Middle School, and Princess Anne High School.
Ownership History
Date
Name
Owned For
Owner Type
Purchase Details
Closed on
Jul 11, 2025
Sold by
Wanis Hargeial N and Smith John Matthew
Bought by
Smith John Matthew
Current Estimated Value
Home Financials for this Owner
Home Financials are based on the most recent Mortgage that was taken out on this home.
Original Mortgage
$302,197
Outstanding Balance
$301,685
Interest Rate
6.85%
Mortgage Type
FHA
Estimated Equity
$200,882
Purchase Details
Closed on
Jan 31, 2012
Sold by
Equity Trustees Llc and Ray David K
Bought by
Consumer Properties Llc
Purchase Details
Closed on
Aug 14, 2002
Sold by
Free Reginald P
Bought by
Ray David K
Home Financials for this Owner
Home Financials are based on the most recent Mortgage that was taken out on this home.
Original Mortgage
$125,300
Interest Rate
6.48%
Create a Home Valuation Report for This Property
The Home Valuation Report is an in-depth analysis detailing your home's value as well as a comparison with similar homes in the area
Home Values in the Area
Average Home Value in this Area
Purchase History
| Date | Buyer | Sale Price | Title Company |
|---|---|---|---|
| Smith John Matthew | -- | Fidelity National Title | |
| Consumer Properties Llc | $212,000 | -- | |
| Ray David K | $127,200 | -- |
Source: Public Records
Mortgage History
| Date | Status | Borrower | Loan Amount |
|---|---|---|---|
| Open | Smith John Matthew | $302,197 | |
| Previous Owner | Ray David K | $125,300 |
Source: Public Records
Tax History Compared to Growth
Tax History
| Year | Tax Paid | Tax Assessment Tax Assessment Total Assessment is a certain percentage of the fair market value that is determined by local assessors to be the total taxable value of land and additions on the property. | Land | Improvement |
|---|---|---|---|---|
| 2025 | $4,245 | $459,200 | $135,000 | $324,200 |
| 2024 | $4,245 | $437,600 | $135,000 | $302,600 |
| 2023 | $4,023 | $406,400 | $120,000 | $286,400 |
| 2022 | $3,825 | $386,400 | $100,000 | $286,400 |
| 2021 | $3,382 | $341,600 | $80,400 | $261,200 |
| 2020 | $3,321 | $326,400 | $80,400 | $246,000 |
| 2019 | $3,250 | $314,200 | $80,400 | $233,800 |
| 2018 | $3,150 | $314,200 | $80,400 | $233,800 |
| 2017 | $3,043 | $303,500 | $80,400 | $223,100 |
| 2016 | $3,005 | $303,500 | $80,400 | $223,100 |
| 2015 | $3,014 | $304,400 | $80,400 | $224,000 |
| 2014 | $2,558 | $292,100 | $104,400 | $187,700 |
Source: Public Records
Map
Nearby Homes
- 3717 Starlighter Dr
- 3509 Melinda Place
- 3549 Silina Dr
- 3752 Kings Point Arch
- 3549 Barry St
- 224 Cassady Ave
- 149 Paladin Dr
- 3416 Victoria Dr
- 420 Kings Point Ct
- 3528 Hilber St
- 3705 Kings Point Cir
- 200 Victoria Dr
- 3816 Old Forge Rd
- 3828 Concord Bridge Rd
- 3909 W Colonial Pkwy
- 1329 Sebastian Ct
- 1361 Sebastian Ct
- 1313 Sebastian Ct
- 1304 Sebastian Ct
- 1233 Sebastian Ct
- 3704 Appalachian Ct
- 3701 Teakwood Dr
- 3705 Teakwood Dr
- 3616 Adirondack Ct
- 3708 Appalachian Ct
- 3701 Appalachian Ct
- 200 N Donnawood Dr
- 3709 Teakwood Dr
- 3613 Adirondack Ct
- 3612 Adirondack Ct
- 3645 Teakwood Dr
- 3712 Appalachian Ct
- 3709 Appalachian Ct
- 3713 Teakwood Dr
- 213 N Donnawood Dr
- 212 N Donnawood Dr
- 3609 Adirondack Ct
- 3704 Teakwood Dr
- 3700 N Donnawood Ct
- 3608 Adirondack Ct