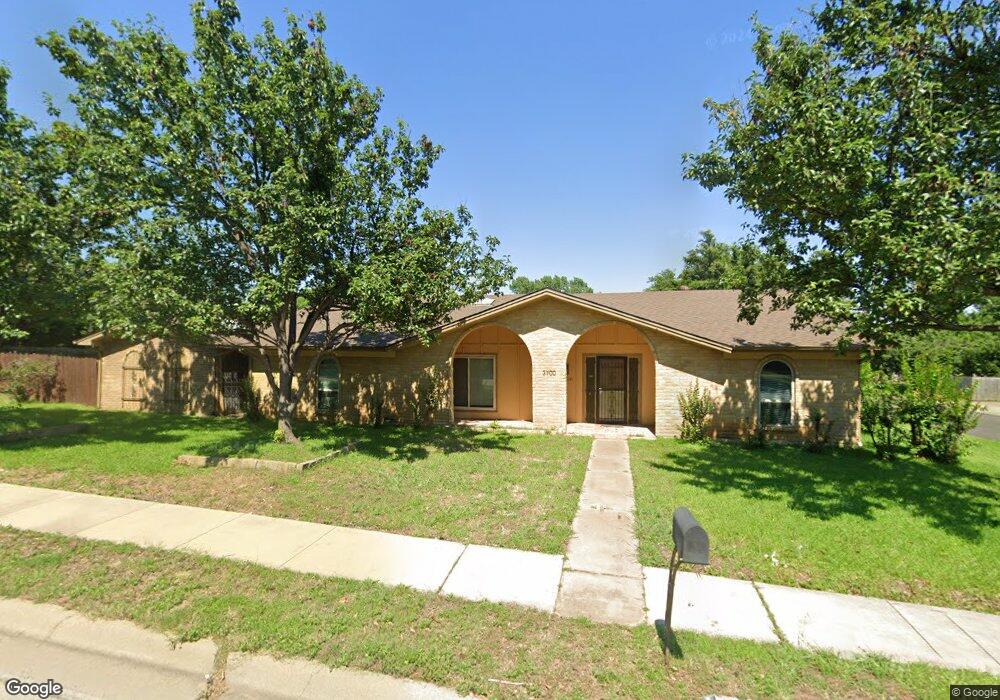
3700 Brown Trail Bedford, TX 76021
Estimated Value: $388,000 - $426,000
3
Beds
2
Baths
2,042
Sq Ft
$203/Sq Ft
Est. Value
About This Home
This home is located at 3700 Brown Trail, Bedford, TX 76021 and is currently estimated at $415,147, approximately $203 per square foot. 3700 Brown Trail is a home located in Tarrant County with nearby schools including Bedford Heights Elementary School, Bedford Junior High School, and L.D. Bell High School.
Ownership History
Date
Name
Owned For
Owner Type
Purchase Details
Closed on
Jul 12, 2024
Sold by
Pacheco Lizbeth
Bought by
Pacheco Paul J
Current Estimated Value
Purchase Details
Closed on
May 28, 2019
Sold by
Godwin Byron N
Bought by
Pacheco Paul J and Pacheco Lizbeth
Home Financials for this Owner
Home Financials are based on the most recent Mortgage that was taken out on this home.
Original Mortgage
$269,900
Interest Rate
4.1%
Mortgage Type
VA
Purchase Details
Closed on
Jul 16, 2013
Sold by
French Jessie A and French Jessie A
Bought by
Godwin Bryon N
Home Financials for this Owner
Home Financials are based on the most recent Mortgage that was taken out on this home.
Original Mortgage
$126,373
Interest Rate
3.94%
Mortgage Type
FHA
Create a Home Valuation Report for This Property
The Home Valuation Report is an in-depth analysis detailing your home's value as well as a comparison with similar homes in the area
Home Values in the Area
Average Home Value in this Area
Purchase History
| Date | Buyer | Sale Price | Title Company |
|---|---|---|---|
| Pacheco Paul J | -- | None Listed On Document | |
| Pacheco Paul J | -- | Freedom Title | |
| Godwin Bryon N | -- | None Available |
Source: Public Records
Mortgage History
| Date | Status | Borrower | Loan Amount |
|---|---|---|---|
| Previous Owner | Pacheco Paul J | $269,900 | |
| Previous Owner | Godwin Bryon N | $126,373 |
Source: Public Records
Tax History Compared to Growth
Tax History
| Year | Tax Paid | Tax Assessment Tax Assessment Total Assessment is a certain percentage of the fair market value that is determined by local assessors to be the total taxable value of land and additions on the property. | Land | Improvement |
|---|---|---|---|---|
| 2025 | $6,467 | $320,810 | $65,000 | $255,810 |
| 2024 | $6,467 | $436,830 | $65,000 | $371,830 |
| 2023 | $5,842 | $398,126 | $45,000 | $353,126 |
| 2022 | $7,444 | $370,954 | $45,000 | $325,954 |
| 2021 | $7,299 | $323,772 | $45,000 | $278,772 |
| 2020 | $6,697 | $281,682 | $45,000 | $236,682 |
| 2019 | $5,860 | $251,572 | $45,000 | $206,572 |
| 2018 | $4,824 | $219,297 | $45,000 | $174,297 |
| 2017 | $4,823 | $199,361 | $30,000 | $169,361 |
| 2016 | $4,444 | $183,683 | $30,000 | $153,683 |
| 2015 | $3,345 | $133,200 | $20,000 | $113,200 |
| 2014 | $3,345 | $133,200 | $20,000 | $113,200 |
Source: Public Records
Map
Nearby Homes
- 628 Huntwich Dr
- 405 Woodbriar Ct
- 3605 Spring Valley Dr
- 909 Brestol Ct W
- 3609 Wayne Ct
- 305 Warbler Dr
- 3624 Wayne Ct
- 320 Blue Quail Ct
- 3213 Spring Valley Dr
- 913 Kensington Ct
- 1109 Simpson Terrace
- 3119 Spring Grove Dr
- 3713 Brentwood Ct
- 4105 Inwood Ln
- 1136 Wingate Dr
- 4002 Copperwood Ct
- 3907 Copperwood Ct
- 801 Shady Creek Ln
- 3301 Wendover Ct
- 1209 Hillandale Ct
- 605 Harwood Terrace
- 600 Morning Glory Ln
- 604 Morning Glory Ln
- 3632 Brown Trail
- 609 Harwood Terrace
- 608 Morning Glory Ln
- 3613 Briarbrook Ct
- 3609 Briarbrook Ct
- 3628 Brown Trail
- 3633 Harber Dr
- 613 Harwood Terrace
- 612 Morning Glory Ln
- 3629 Harber Dr
- 601 Morning Glory Ln
- 3605 Briarbrook Ct
- 605 Morning Glory Ln
- 3624 Brown Trail
- 609 Morning Glory Ln
- 701 Harwood Terrace
- 613 Morning Glory Ln