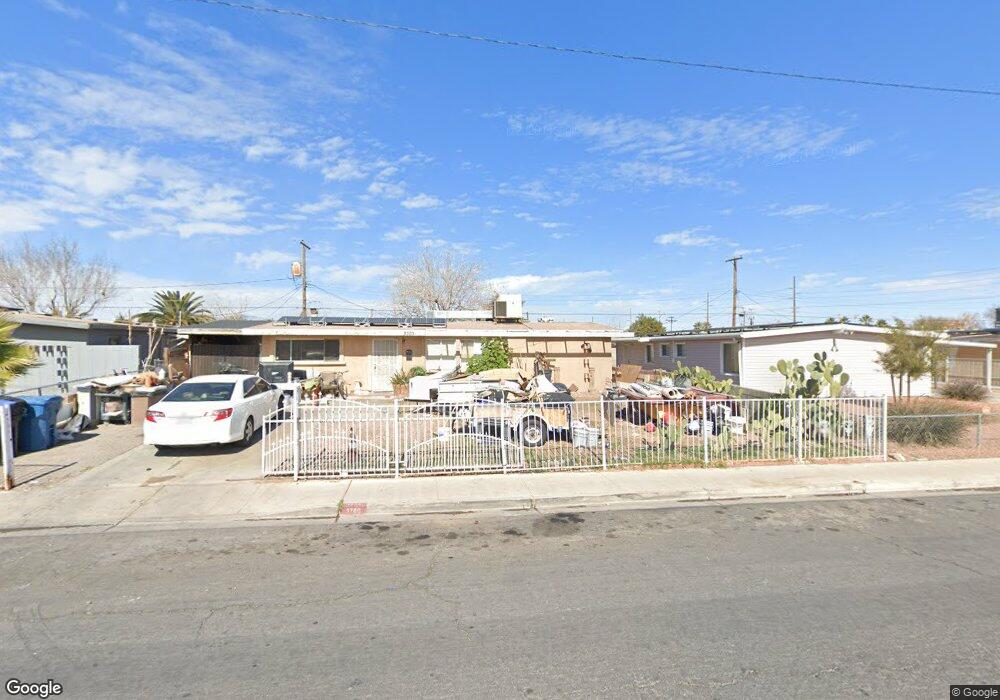
3700 E Webb Ave North Las Vegas, NV 89030
Downtown North Las Vegas NeighborhoodEstimated Value: $289,536 - $330,000
3
Beds
1
Bath
1,242
Sq Ft
$250/Sq Ft
Est. Value
About This Home
This home is located at 3700 E Webb Ave, North Las Vegas, NV 89030 and is currently estimated at $310,884, approximately $250 per square foot. 3700 E Webb Ave is a home located in Clark County with nearby schools including Tom Williams Elementary School, J.D. Smith Middle School, and Desert Pines High School.
Ownership History
Date
Name
Owned For
Owner Type
Purchase Details
Closed on
Jul 14, 2006
Sold by
Zohner Steve
Bought by
Dejesus Clemente
Current Estimated Value
Home Financials for this Owner
Home Financials are based on the most recent Mortgage that was taken out on this home.
Original Mortgage
$157,500
Outstanding Balance
$106,823
Interest Rate
9.4%
Mortgage Type
Unknown
Estimated Equity
$204,061
Purchase Details
Closed on
Apr 12, 2004
Sold by
Reber Adam R and Reber Kristen
Bought by
Zohner Steve
Home Financials for this Owner
Home Financials are based on the most recent Mortgage that was taken out on this home.
Original Mortgage
$92,000
Interest Rate
6.4%
Mortgage Type
Unknown
Purchase Details
Closed on
Apr 19, 2001
Sold by
Goranitis George and Goranitis Verna T
Bought by
Reber Adam R
Home Financials for this Owner
Home Financials are based on the most recent Mortgage that was taken out on this home.
Original Mortgage
$93,023
Interest Rate
7.25%
Create a Home Valuation Report for This Property
The Home Valuation Report is an in-depth analysis detailing your home's value as well as a comparison with similar homes in the area
Home Values in the Area
Average Home Value in this Area
Purchase History
| Date | Buyer | Sale Price | Title Company |
|---|---|---|---|
| Dejesus Clemente | $210,000 | National Alliance Title | |
| Zohner Steve | $115,000 | Fidelity National Title | |
| Reber Adam R | $95,900 | Fidelity National Title |
Source: Public Records
Mortgage History
| Date | Status | Borrower | Loan Amount |
|---|---|---|---|
| Open | Dejesus Clemente | $157,500 | |
| Previous Owner | Zohner Steve | $92,000 | |
| Previous Owner | Reber Adam R | $93,023 | |
| Closed | Zohner Steve | $23,000 |
Source: Public Records
Tax History Compared to Growth
Tax History
| Year | Tax Paid | Tax Assessment Tax Assessment Total Assessment is a certain percentage of the fair market value that is determined by local assessors to be the total taxable value of land and additions on the property. | Land | Improvement |
|---|---|---|---|---|
| 2025 | $723 | $40,633 | $24,150 | $16,483 |
| 2024 | $670 | $40,633 | $24,150 | $16,483 |
| 2023 | $446 | $40,762 | $25,900 | $14,862 |
| 2022 | $621 | $35,040 | $21,700 | $13,340 |
| 2021 | $575 | $32,673 | $20,300 | $12,373 |
| 2020 | $531 | $31,283 | $19,250 | $12,033 |
| 2019 | $498 | $27,368 | $15,750 | $11,618 |
| 2018 | $475 | $23,483 | $12,600 | $10,883 |
| 2017 | $714 | $21,280 | $10,500 | $10,780 |
| 2016 | $446 | $17,481 | $7,000 | $10,481 |
| 2015 | $444 | $15,761 | $5,600 | $10,161 |
| 2014 | $430 | $13,382 | $4,200 | $9,182 |
Source: Public Records
Map
Nearby Homes
- 3601 E Webb Ave
- 3600 Reynolds Ave
- 1620 Kenneth St
- 3220 Stanley Ave
- 3633 Karissa Heights Place
- 1830 N Pecos Rd Unit 252
- 1830 N Pecos Rd Unit 230
- 1830 N Pecos Rd Unit 137
- 3205 Mary Ann Ave
- 3200 E Owens Ave
- 1766 Molly Meadows St
- 1606 Sugita Ln
- 3320 Osage Ave
- 1891 Via Del Prado St
- 3212 Osage Ave
- 1839 Vida Pacifica St
- 3204 Osage Ave
- 3795 E Pecan Ln
- 1720 Belmont St
- 4924 Chidlaw Ave Unit 3
- 3616 E Webb Ave
- 3704 E Webb Ave
- 3701 Stanley Ave
- 3708 E Webb Ave
- 3612 E Webb Ave
- 3705 Stanley Ave
- 3617 Stanley Ave
- 3701 E Webb Ave
- 3709 Stanley Ave
- 3615 Stanley Ave
- 3617 E Webb Ave
- 3712 E Webb Ave
- 3608 E Webb Ave
- 3615 E Webb Ave
- 3715 Stanley Ave
- 3609 Stanley Ave
- 3609 E Webb Ave
- 3604 E Webb Ave
- 3716 E Webb Ave
- 3700 E Owens Ave