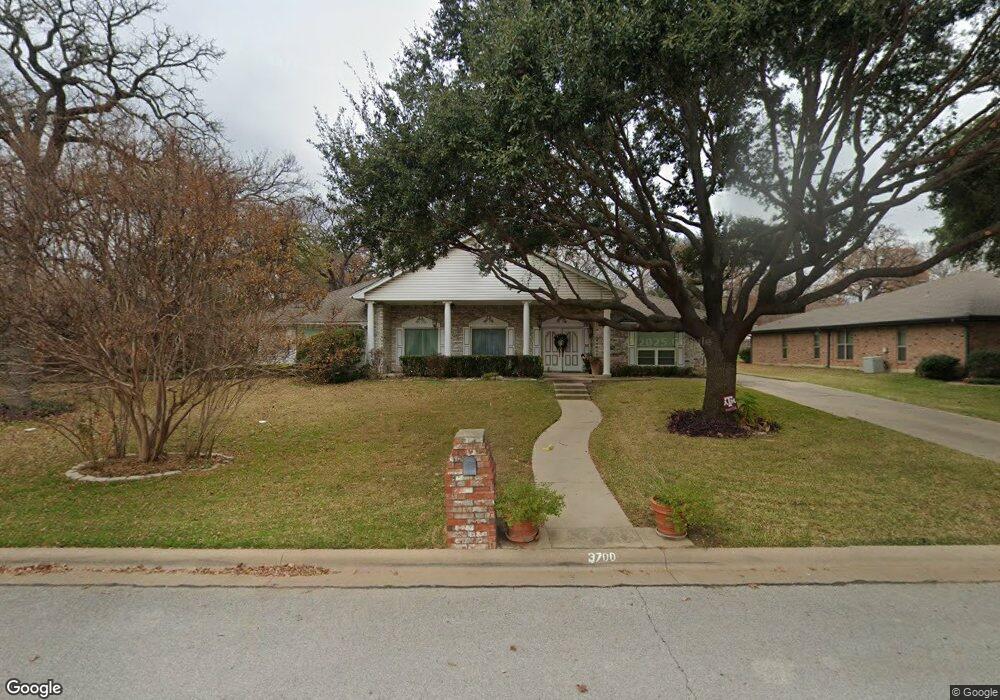
3700 Greenbriar Ct Colleyville, TX 76034
Estimated Value: $622,751 - $737,000
3
Beds
2
Baths
3,167
Sq Ft
$215/Sq Ft
Est. Value
About This Home
This home is located at 3700 Greenbriar Ct, Colleyville, TX 76034 and is currently estimated at $680,188, approximately $214 per square foot. 3700 Greenbriar Ct is a home located in Tarrant County with nearby schools including Bedford Heights Elementary School, Bedford Junior High School, and L.D. Bell High School.
Create a Home Valuation Report for This Property
The Home Valuation Report is an in-depth analysis detailing your home's value as well as a comparison with similar homes in the area
Home Values in the Area
Average Home Value in this Area
Tax History Compared to Growth
Tax History
| Year | Tax Paid | Tax Assessment Tax Assessment Total Assessment is a certain percentage of the fair market value that is determined by local assessors to be the total taxable value of land and additions on the property. | Land | Improvement |
|---|---|---|---|---|
| 2025 | $1,985 | $573,318 | $115,000 | $458,318 |
| 2024 | $1,985 | $573,318 | $115,000 | $458,318 |
| 2023 | $7,919 | $533,437 | $85,000 | $448,437 |
| 2022 | $8,357 | $490,597 | $85,000 | $405,597 |
| 2021 | $8,130 | $388,810 | $85,000 | $303,810 |
| 2020 | $8,280 | $391,406 | $85,000 | $306,406 |
| 2019 | $8,622 | $394,003 | $85,000 | $309,003 |
| 2018 | $3,363 | $358,172 | $85,000 | $273,172 |
| 2017 | $7,430 | $347,655 | $50,000 | $297,655 |
| 2016 | $6,754 | $304,955 | $50,000 | $254,955 |
| 2015 | $3,830 | $269,100 | $35,000 | $234,100 |
| 2014 | $3,830 | $269,100 | $35,000 | $234,100 |
Source: Public Records
Map
Nearby Homes
- 3713 Brentwood Ct
- 405 Woodbriar Ct
- 305 Warbler Dr
- 2620 Brookridge Dr
- 2732 Woodbridge Dr
- 320 Blue Quail Ct
- 404 Heather Ln
- 628 Huntwich Dr
- 2244 Hurstview Dr
- 2212 Mountainview Dr
- 3605 Spring Valley Dr
- 2212 Hurstview Dr
- 2668 Bent Tree Dr
- 909 Brestol Ct W
- 3213 Spring Valley Dr
- 405 Bremen Dr
- 312 Bremen Dr
- 2844 Hurstview Dr
- 3609 Wayne Ct
- 712 Springwood Dr
- 3616 Greenbriar Ct
- 3704 Greenbriar Ct
- 3701 San Bar Ln
- 3705 San Bar Ln
- 3708 Greenbriar Ct
- 3617 San Bar Ln
- 3705 Greenbriar Ct
- 3701 Greenbriar Ct
- 3612 Greenbriar Ct
- 3709 San Bar Ln
- 3709 Greenbriar Ct
- 3613 San Bar Ln
- 3712 Greenbriar Ct
- 3613 Greenbriar Ct
- 3617 Greenbriar Ct
- 3713 Greenbriar Ct
- 3713 San Bar Ln
- 3704 San Bar Ln
- 3708 San Bar Ln
- 3700 San Bar Ln