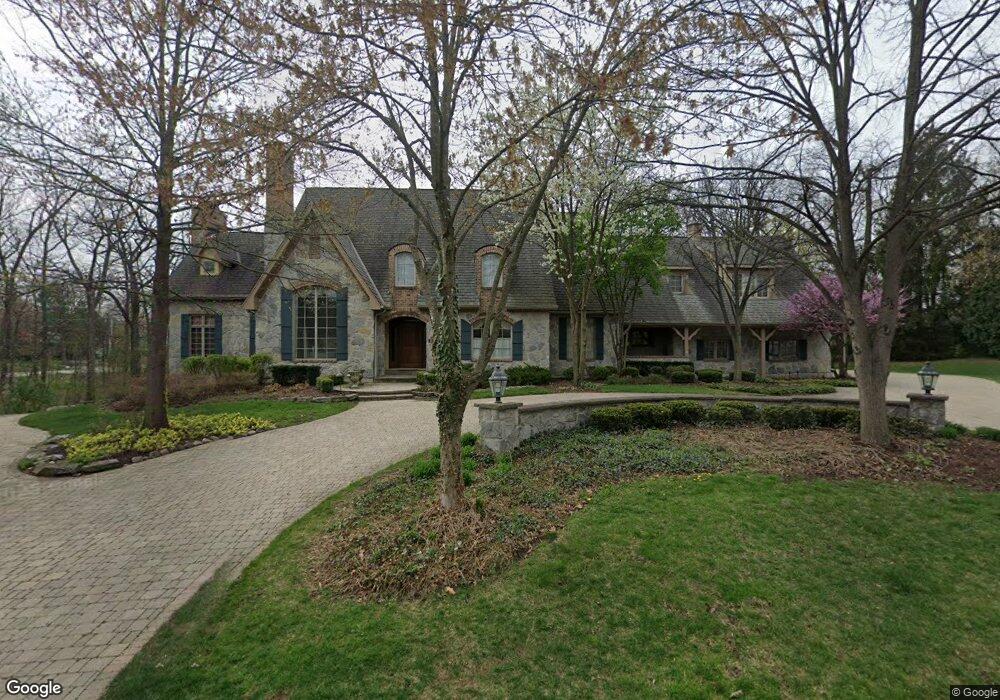
3700 Sterling Rd Downers Grove, IL 60515
Estimated Value: $1,324,000 - $1,891,000
--
Bed
--
Bath
5,522
Sq Ft
$283/Sq Ft
Est. Value
About This Home
This home is located at 3700 Sterling Rd, Downers Grove, IL 60515 and is currently estimated at $1,563,861, approximately $283 per square foot. 3700 Sterling Rd is a home located in DuPage County with nearby schools including Highland Elementary School, Herrick Middle School, and Downer Grove North High School.
Ownership History
Date
Name
Owned For
Owner Type
Purchase Details
Closed on
Oct 25, 2004
Sold by
Pouleson John and Pouleson Joan
Bought by
Pouleson Joan A and Joan A Pouleson Declaration Of Trust
Current Estimated Value
Purchase Details
Closed on
Aug 21, 2000
Sold by
Pouleson John and Pouleson Joan
Bought by
Joan A Pouleson Declaration Of Living Tr
Purchase Details
Closed on
Nov 10, 1999
Sold by
September Homes Inc
Bought by
Pouleson John and Pouleson Joan
Home Financials for this Owner
Home Financials are based on the most recent Mortgage that was taken out on this home.
Original Mortgage
$176,000
Outstanding Balance
$51,146
Interest Rate
7.12%
Mortgage Type
Credit Line Revolving
Estimated Equity
$1,512,715
Purchase Details
Closed on
Jun 18, 1997
Sold by
Flynn Thomas F
Bought by
September Homes Inc
Purchase Details
Closed on
Jun 4, 1997
Sold by
First Bank National Assn Of Chicago
Bought by
Flynn Thomas F
Create a Home Valuation Report for This Property
The Home Valuation Report is an in-depth analysis detailing your home's value as well as a comparison with similar homes in the area
Home Values in the Area
Average Home Value in this Area
Purchase History
| Date | Buyer | Sale Price | Title Company |
|---|---|---|---|
| Pouleson Joan A | -- | -- | |
| Joan A Pouleson Declaration Of Living Tr | -- | -- | |
| Pouleson John | $1,076,000 | -- | |
| September Homes Inc | -- | -- | |
| Flynn Thomas F | $200,000 | -- |
Source: Public Records
Mortgage History
| Date | Status | Borrower | Loan Amount |
|---|---|---|---|
| Open | Pouleson John | $176,000 | |
| Closed | Pouleson John | $300,000 |
Source: Public Records
Tax History Compared to Growth
Tax History
| Year | Tax Paid | Tax Assessment Tax Assessment Total Assessment is a certain percentage of the fair market value that is determined by local assessors to be the total taxable value of land and additions on the property. | Land | Improvement |
|---|---|---|---|---|
| 2024 | $24,681 | $515,449 | $81,462 | $433,987 |
| 2023 | $23,671 | $476,650 | $75,330 | $401,320 |
| 2022 | $22,768 | $458,180 | $72,410 | $385,770 |
| 2021 | $20,892 | $446,790 | $70,610 | $376,180 |
| 2020 | $20,391 | $437,000 | $69,060 | $367,940 |
| 2019 | $29,407 | $619,210 | $65,660 | $553,550 |
| 2018 | $27,194 | $563,610 | $59,760 | $503,850 |
| 2017 | $26,038 | $537,080 | $56,950 | $480,130 |
| 2016 | $25,265 | $505,960 | $53,650 | $452,310 |
| 2015 | $24,706 | $471,360 | $49,980 | $421,380 |
| 2014 | $24,000 | $442,390 | $64,570 | $377,820 |
| 2013 | $24,009 | $448,630 | $65,480 | $383,150 |
Source: Public Records
Map
Nearby Homes
- 3730 Sterling Rd
- 525 36th St
- 3910 Sterling Rd
- 3919 Washington St
- 3412 Meyers Rd
- 2919 35th St
- 3220 Meyers Rd
- 1136 Barneswood Dr
- Lot 3910 Sterling Rd
- 1014 Braemoor Dr Unit B
- 2S761 Theresa Ct Unit 761
- 19W019 Avenue Barbizon Unit 2
- 4111 Douglas Rd
- 4133 Lindley St
- 4117 Sterling Rd
- 248 41st St
- 1148 Mistwood Ln Unit D
- 4218 Florence Ave
- 3112 Cara Ln
- 19W147 Avenue Rue Royal
- 3718 Sterling Rd
- 631 37th St
- 3648 Sterling Rd
- 3722 Sterling Rd
- 630 37th St
- 3713 Sterling Rd
- 3715 Sterling Rd
- 3642 Sterling Rd
- 635 37th St
- 3726 Sterling Rd
- 3729 Glendenning Rd
- 3655 Glendenning Rd
- 3725 Glendenning Rd
- 548 37th St
- 3717 Sterling Rd
- 3733 Glendenning Rd
- 545 37th St
- 3641 Glendenning Rd
- 3636 Sterling Rd
- 3636 Sterling Rd