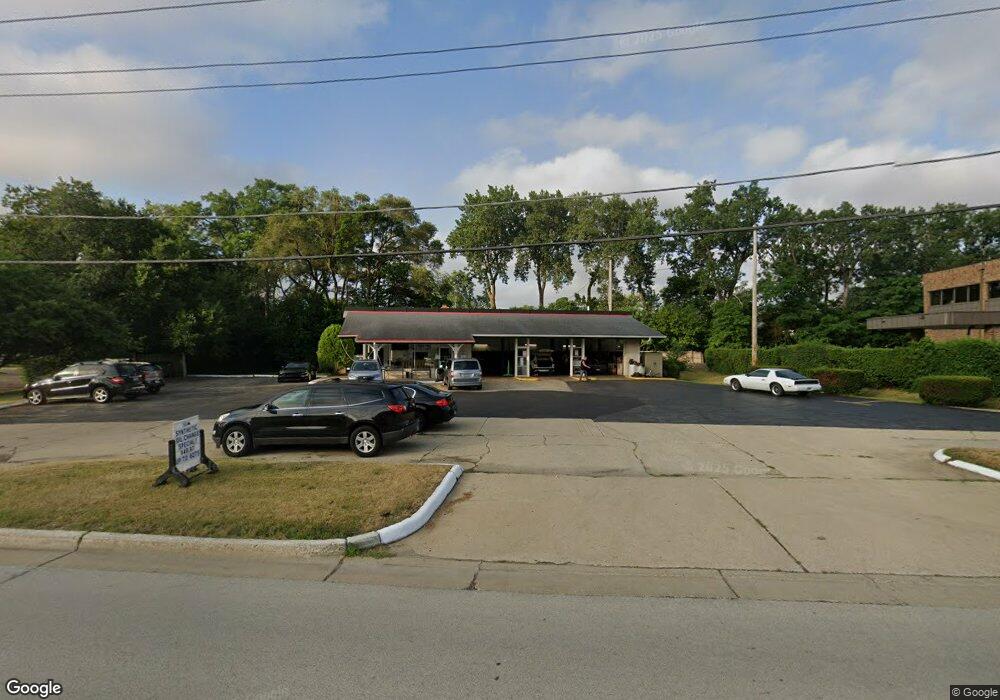
3701 Kirchoff Rd Rolling Meadows, IL 60008
Estimated Value: $629,566
Studio
--
Bath
3,000
Sq Ft
$210/Sq Ft
Est. Value
About This Home
This home is located at 3701 Kirchoff Rd, Rolling Meadows, IL 60008 and is currently estimated at $629,566, approximately $209 per square foot. 3701 Kirchoff Rd is a home located in Cook County with nearby schools including Willow Bend Elementary School, Carl Sandburg Junior High School, and Rolling Meadows High School.
Ownership History
Date
Name
Owned For
Owner Type
Purchase Details
Closed on
Dec 7, 2022
Sold by
Bahk Max S and Chi Song
Bought by
Tjr Enterprises Llc
Current Estimated Value
Home Financials for this Owner
Home Financials are based on the most recent Mortgage that was taken out on this home.
Original Mortgage
$375,000
Outstanding Balance
$362,904
Interest Rate
7.08%
Mortgage Type
Seller Take Back
Estimated Equity
$266,662
Purchase Details
Closed on
Jul 17, 2009
Sold by
Burba Evelyn R
Bought by
Bahk Max S and Park Chi Song
Home Financials for this Owner
Home Financials are based on the most recent Mortgage that was taken out on this home.
Original Mortgage
$265,000
Interest Rate
6.5%
Mortgage Type
Commercial
Purchase Details
Closed on
Dec 18, 1996
Sold by
Parkway Bank & Trust Company
Bought by
Burba Evelyn R and Evelyn R Burba Trust
Create a Home Valuation Report for This Property
The Home Valuation Report is an in-depth analysis detailing your home's value as well as a comparison with similar homes in the area
Home Values in the Area
Average Home Value in this Area
Purchase History
| Date | Buyer | Sale Price | Title Company |
|---|---|---|---|
| Tjr Enterprises Llc | $500,000 | None Listed On Document | |
| Bahk Max S | $530,000 | None Available | |
| Burba Evelyn R | -- | -- |
Source: Public Records
Mortgage History
| Date | Status | Borrower | Loan Amount |
|---|---|---|---|
| Open | Tjr Enterprises Llc | $375,000 | |
| Previous Owner | Bahk Max S | $265,000 |
Source: Public Records
Tax History
| Year | Tax Paid | Tax Assessment Tax Assessment Total Assessment is a certain percentage of the fair market value that is determined by local assessors to be the total taxable value of land and additions on the property. | Land | Improvement |
|---|---|---|---|---|
| 2025 | $23,515 | $83,250 | $58,926 | $24,324 |
| 2024 | $23,515 | $76,727 | $58,926 | $17,801 |
| 2023 | $22,520 | $76,727 | $58,926 | $17,801 |
| 2022 | $22,520 | $76,727 | $58,926 | $17,801 |
| 2021 | $22,933 | $69,250 | $58,925 | $10,325 |
| 2020 | $22,393 | $69,250 | $58,925 | $10,325 |
| 2019 | $20,147 | $69,250 | $58,925 | $10,325 |
| 2018 | $20,041 | $61,875 | $32,862 | $29,013 |
| 2017 | $19,633 | $61,875 | $32,862 | $29,013 |
| 2016 | $18,290 | $61,875 | $32,862 | $29,013 |
| 2015 | $19,157 | $60,843 | $29,462 | $31,381 |
| 2014 | $18,699 | $60,843 | $29,462 | $31,381 |
| 2013 | $18,251 | $60,843 | $29,462 | $31,381 |
Source: Public Records
Map
Nearby Homes
- 2401 Rohlwing Rd
- 2600 Brookwood Way Dr Unit 316
- 2600 Brookwood Way Dr Unit 305
- 2650 Brookwood Way Dr Unit 313
- 2650 Brookwood Way Dr Unit 108
- 3345 Kirchoff Rd Unit 5C
- 3265 Kirchoff Rd Unit 116
- 3 Holyoke on Auburn
- 304 E Tall Trees Ln
- 3135 Town Square Dr Unit 401
- 3100 Town Square Dr Unit 308
- 3100 Town Square Dr Unit 204
- 3000 California Ave
- 3407 Pheasant Dr
- 399 Knollwood Ct
- 2705 Park St
- 3200 Thrush Ln
- 3306 Trillium Cir Unit 3001
- 3209 Trillium Cir
- 2709 Lily Ln
- 3704 Rywick Ct
- 3706 Rywick Ct
- 3702 Rywick Ct
- 3708 Rywick Ct
- 3800 Rywick Ct
- 3618 Kirchoff Rd
- 3700 Rywick Ct
- 2805 Flicker Ln
- 3701 Rywick Ct
- 3616 Kirchoff Rd
- 3705 Rywick Ct
- 3703 Rywick Ct
- 2804 Flicker Ln
- 3707 Rywick Ct
- 3702 Kirchoff Rd
- 3614 Kirchoff Rd
- 3709 Rywick Ct
- 3609 Kirchoff Rd
- 3801 Rywick Ct
- 3612 Kirchoff Rd
Your Personal Tour Guide
Ask me questions while you tour the home.