Estimated Value: $323,087 - $370,000
3
Beds
1
Bath
1,110
Sq Ft
$307/Sq Ft
Est. Value
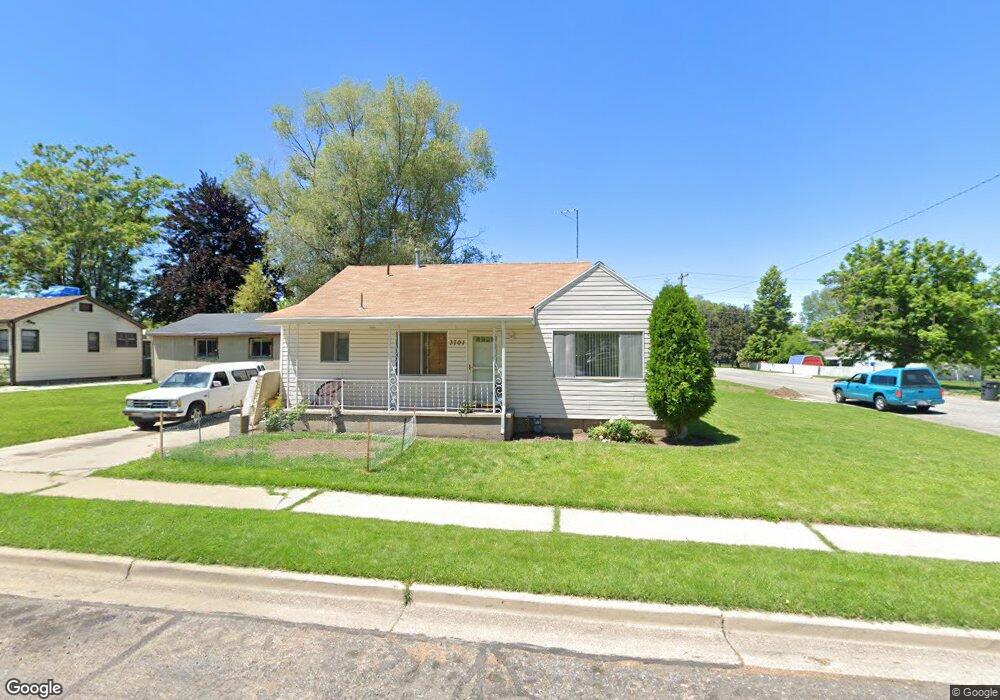
About This Home
This home is located at 3701 Porter Ave, Ogden, UT 84403 and is currently estimated at $341,272, approximately $307 per square foot. 3701 Porter Ave is a home located in Weber County with nearby schools including Burch Creek School, South Ogden Junior High School, and Bonneville High School.
Ownership History
Date
Name
Owned For
Owner Type
Purchase Details
Closed on
Sep 20, 2011
Sold by
Jones Helen B
Bought by
Jones Helen B
Current Estimated Value
Purchase Details
Closed on
Sep 10, 2011
Sold by
Jones Helen B
Bought by
Jones Helen B
Purchase Details
Closed on
May 20, 2000
Sold by
Jensen Helen B and Jensen Helen
Bought by
Jones Helen B
Home Financials for this Owner
Home Financials are based on the most recent Mortgage that was taken out on this home.
Original Mortgage
$9,262
Outstanding Balance
$3,218
Interest Rate
8.22%
Estimated Equity
$338,054
Create a Home Valuation Report for This Property
The Home Valuation Report is an in-depth analysis detailing your home's value as well as a comparison with similar homes in the area
Home Values in the Area
Average Home Value in this Area
Purchase History
| Date | Buyer | Sale Price | Title Company |
|---|---|---|---|
| Jones Helen B | -- | None Available | |
| Jones Helen B | -- | None Available | |
| Jones Helen B | -- | -- |
Source: Public Records
Mortgage History
| Date | Status | Borrower | Loan Amount |
|---|---|---|---|
| Open | Jones Helen B | $9,262 |
Source: Public Records
Tax History
| Year | Tax Paid | Tax Assessment Tax Assessment Total Assessment is a certain percentage of the fair market value that is determined by local assessors to be the total taxable value of land and additions on the property. | Land | Improvement |
|---|---|---|---|---|
| 2025 | $2,254 | $302,330 | $106,482 | $195,848 |
| 2024 | $2,116 | $288,999 | $106,482 | $182,517 |
| 2023 | $2,032 | $279,000 | $105,810 | $173,190 |
| 2022 | $2,026 | $289,000 | $85,862 | $203,138 |
| 2021 | $1,652 | $213,002 | $50,713 | $162,289 |
| 2020 | $1,560 | $187,000 | $40,601 | $146,399 |
| 2019 | $1,452 | $164,000 | $32,558 | $131,442 |
| 2018 | $1,377 | $147,000 | $32,558 | $114,442 |
| 2017 | $1,214 | $121,000 | $30,578 | $90,422 |
| 2016 | $1,078 | $58,456 | $16,728 | $41,728 |
| 2015 | $1,075 | $57,274 | $16,728 | $40,546 |
| 2014 | $931 | $47,371 | $16,728 | $30,643 |
Source: Public Records
Map
Nearby Homes
Your Personal Tour Guide
Ask me questions while you tour the home.