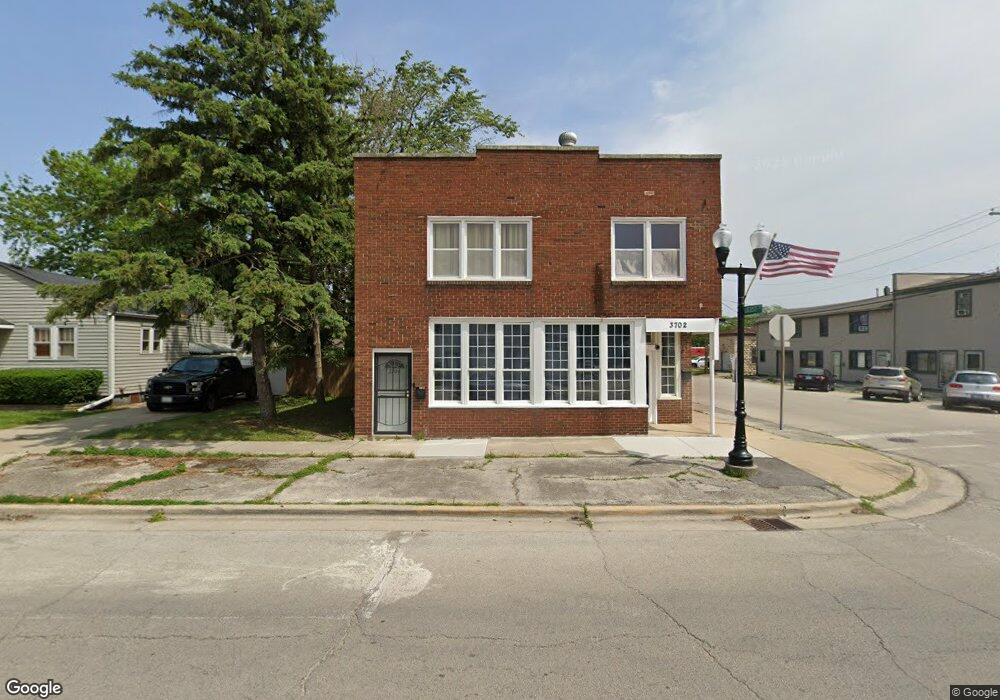
3702 216th St Matteson, IL 60443
Old Matteson NeighborhoodEstimated Value: $196,732 - $236,000
2
Beds
3
Baths
2,382
Sq Ft
$90/Sq Ft
Est. Value
About This Home
This home is located at 3702 216th St, Matteson, IL 60443 and is currently estimated at $214,244, approximately $89 per square foot. 3702 216th St is a home located in Cook County with nearby schools including Illinois School, Matteson Elementary School, and Sauk Elementary School.
Ownership History
Date
Name
Owned For
Owner Type
Purchase Details
Closed on
Aug 3, 1998
Sold by
Small Business Administration
Bought by
Salon Investment Group Inc
Current Estimated Value
Home Financials for this Owner
Home Financials are based on the most recent Mortgage that was taken out on this home.
Original Mortgage
$65,600
Interest Rate
8.25%
Mortgage Type
Commercial
Purchase Details
Closed on
Jul 20, 1995
Sold by
Cavanaugh Michael J and Cavanaugh Kim
Bought by
Cavanaughs Cafe Inc
Home Financials for this Owner
Home Financials are based on the most recent Mortgage that was taken out on this home.
Original Mortgage
$109,000
Interest Rate
7.5%
Mortgage Type
Commercial
Purchase Details
Closed on
Jul 18, 1995
Sold by
Greatbanc Trust Company
Bought by
Cavanaugh Michael J and Cavanaugh Kim
Home Financials for this Owner
Home Financials are based on the most recent Mortgage that was taken out on this home.
Original Mortgage
$109,000
Interest Rate
7.5%
Mortgage Type
Commercial
Create a Home Valuation Report for This Property
The Home Valuation Report is an in-depth analysis detailing your home's value as well as a comparison with similar homes in the area
Home Values in the Area
Average Home Value in this Area
Purchase History
| Date | Buyer | Sale Price | Title Company |
|---|---|---|---|
| Salon Investment Group Inc | $82,000 | Lawyers Title Insurance Corp | |
| Cavanaughs Cafe Inc | -- | 1St American Title | |
| Cavanaugh Michael J | $127,500 | 1St American Title |
Source: Public Records
Mortgage History
| Date | Status | Borrower | Loan Amount |
|---|---|---|---|
| Closed | Salon Investment Group Inc | $65,600 | |
| Previous Owner | Cavanaughs Cafe Inc | $109,000 |
Source: Public Records
Tax History Compared to Growth
Tax History
| Year | Tax Paid | Tax Assessment Tax Assessment Total Assessment is a certain percentage of the fair market value that is determined by local assessors to be the total taxable value of land and additions on the property. | Land | Improvement |
|---|---|---|---|---|
| 2024 | $7,440 | $18,000 | $2,400 | $15,600 |
| 2023 | $10,034 | $18,000 | $2,400 | $15,600 |
| 2022 | $10,034 | $18,495 | $2,100 | $16,395 |
| 2021 | $10,171 | $18,495 | $2,100 | $16,395 |
| 2020 | $9,420 | $18,495 | $2,100 | $16,395 |
| 2019 | $9,925 | $19,176 | $1,950 | $17,226 |
| 2018 | $9,923 | $19,176 | $1,950 | $17,226 |
| 2017 | $9,526 | $19,176 | $1,950 | $17,226 |
| 2016 | $7,116 | $14,472 | $1,800 | $12,672 |
| 2015 | $8,157 | $16,733 | $1,800 | $14,933 |
| 2014 | $7,901 | $16,733 | $1,800 | $14,933 |
| 2013 | $7,785 | $18,036 | $1,800 | $16,236 |
Source: Public Records
Map
Nearby Homes
- 3704 215th St Unit 205
- 3727 214th Place Unit 2
- 21607 Main St
- 3809 215th St
- 3712 214th St
- 3711 213th Place
- 3817 216th Place
- 3422 Station Dr
- 3865 216th St
- 3638 213th St
- 21628 Dogwood Rd Unit 1203
- 242 Hickory St
- 3533 212th Place
- 21612 Wildflower Rd Unit 113-4
- 21209 Oak St
- 549 Homan Ave
- 305 Jackson St
- 3704 Linden Rd
- 21142 Locust St
- 21829 Richton Rd
- 3708 216th St
- 3716 216th St
- 3716 216th St
- 3705 216th St
- 3705 216th St Unit 3R
- 3705 216th St Unit 3F
- 3711 216th St
- 3632 216th St
- 3703 215th St
- 3720 216th St
- 3711 215th St
- 3703 216th St
- 3715 215th St
- 3627 216th St
- 3724 216th St
- 3624 216th St
- 3719 216th St
- 3613 216th St
- 3708 216th Place
- 3704 216th Place