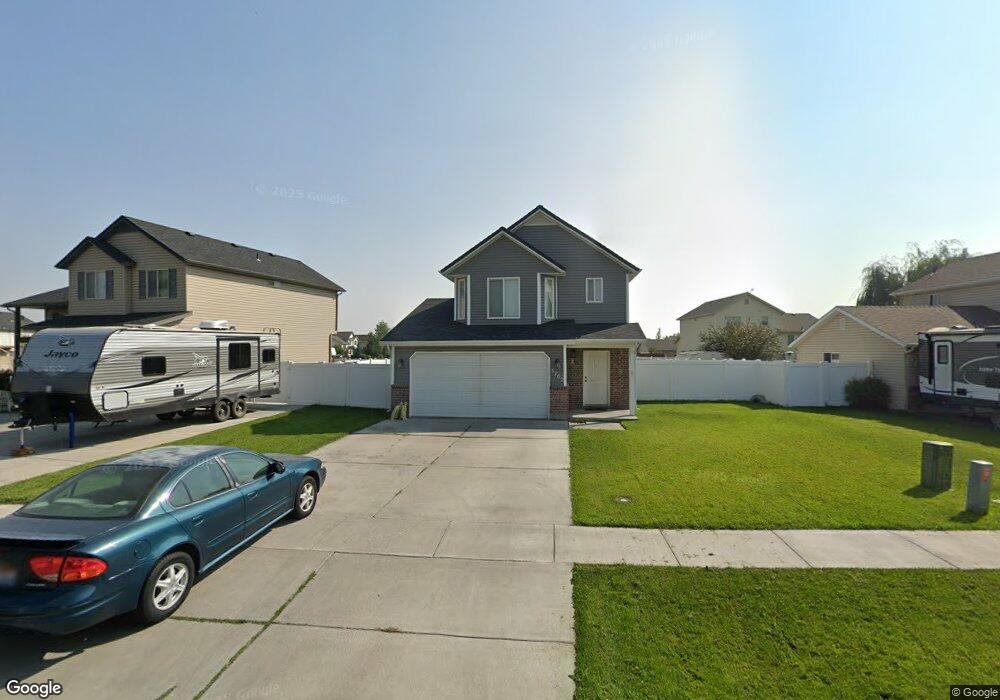
3702 Pearce Dr Idaho Falls, ID 83401
Estimated Value: $315,000 - $340,498
3
Beds
4
Baths
1,446
Sq Ft
$226/Sq Ft
Est. Value
About This Home
This home is located at 3702 Pearce Dr, Idaho Falls, ID 83401 and is currently estimated at $326,625, approximately $225 per square foot. 3702 Pearce Dr is a home located in Bonneville County with nearby schools including Bridgewater Elementary School, Rocky Mountain Middle School, and Bonneville High School.
Ownership History
Date
Name
Owned For
Owner Type
Purchase Details
Closed on
Jan 8, 2014
Sold by
Broadfoot Glenna
Bought by
Broadfoot Glenna and Broadfoot Rick W
Current Estimated Value
Purchase Details
Closed on
Sep 28, 2013
Sold by
Broadfoot Rick W and Broadfoot Glenna
Bought by
Bradfoot Glenna
Home Financials for this Owner
Home Financials are based on the most recent Mortgage that was taken out on this home.
Original Mortgage
$124,500
Outstanding Balance
$93,126
Interest Rate
4.46%
Mortgage Type
New Conventional
Estimated Equity
$233,499
Purchase Details
Closed on
Sep 26, 2013
Sold by
Winders Margaret A
Bought by
Broadfoot Glenna
Home Financials for this Owner
Home Financials are based on the most recent Mortgage that was taken out on this home.
Original Mortgage
$124,500
Outstanding Balance
$93,126
Interest Rate
4.46%
Mortgage Type
New Conventional
Estimated Equity
$233,499
Purchase Details
Closed on
Nov 1, 2005
Sold by
Shirley Adrianne Rene
Bought by
Winders Margaret A
Home Financials for this Owner
Home Financials are based on the most recent Mortgage that was taken out on this home.
Original Mortgage
$114,300
Interest Rate
5.74%
Mortgage Type
New Conventional
Create a Home Valuation Report for This Property
The Home Valuation Report is an in-depth analysis detailing your home's value as well as a comparison with similar homes in the area
Home Values in the Area
Average Home Value in this Area
Purchase History
| Date | Buyer | Sale Price | Title Company |
|---|---|---|---|
| Broadfoot Glenna | -- | Accommodation | |
| Bradfoot Glenna | -- | Mountain View Title & Escrow | |
| Broadfoot Glenna | -- | Mountain West Title & Escrow | |
| Winders Margaret A | -- | -- |
Source: Public Records
Mortgage History
| Date | Status | Borrower | Loan Amount |
|---|---|---|---|
| Open | Broadfoot Glenna | $124,500 | |
| Previous Owner | Winders Margaret A | $114,300 |
Source: Public Records
Tax History Compared to Growth
Tax History
| Year | Tax Paid | Tax Assessment Tax Assessment Total Assessment is a certain percentage of the fair market value that is determined by local assessors to be the total taxable value of land and additions on the property. | Land | Improvement |
|---|---|---|---|---|
| 2025 | $884 | $308,280 | $53,440 | $254,840 |
| 2024 | $884 | $308,262 | $45,246 | $263,016 |
| 2023 | $776 | $251,356 | $45,246 | $206,110 |
| 2022 | $874 | $233,049 | $39,349 | $193,700 |
| 2021 | $853 | $171,619 | $39,349 | $132,270 |
| 2019 | $971 | $144,347 | $28,947 | $115,400 |
| 2018 | $875 | $151,028 | $26,318 | $124,710 |
| 2017 | $829 | $132,228 | $21,928 | $110,300 |
| 2016 | $843 | $124,508 | $21,928 | $102,580 |
| 2015 | $768 | $111,689 | $19,709 | $91,980 |
| 2014 | $22,008 | $111,689 | $19,709 | $91,980 |
| 2013 | $730 | $108,649 | $19,709 | $88,940 |
Source: Public Records
Map
Nearby Homes
- 3665 E Pearce Dr
- 3691 Capstone Dr
- 3694 Capstone Dr
- 3807 Greenwillow Ln
- 3617 E Lincoln Rd
- 1091 Cornerstone Dr
- 3832 E Deer Creek
- 955 Eve Dr
- 3920 E Deer Creek
- 949 Eve Dr
- 4019 E Lincoln Rd
- 4205 Roy Cir
- 3185 E Greenwillow Ln
- 4125 Lance St
- 4211 E Roy Cir
- 1261 Trappers Ridge
- 928 N Greenwillow Ln
- 2406 N Ammon Rd
- 3149 Bergeson Dr
- 635 Butterfly Dr
- 3702 E Pearce Dr
- 3718 E Pearce Dr
- 3690 Pearce Dr
- 3690 E Pearce Dr
- 3718 Pearce Dr
- 3703 Goldstone Dr
- 3678 Pearce Dr
- 3687 Goldstone Dr
- 3709 E Pearce Dr
- 3709 Pearce Dr
- 3795 E Pearce Dr
- 3668 Pearce Dr
- 3725 E Pearce Dr
- 3673 Goldstone Dr
- 3727 E Pearce Dr
- 3727 Pearce Dr
- 3683 Pearce Dr
- 3683 E Pearce Dr
- 1364 Stevens Dr
- 1336 Stevens Dr