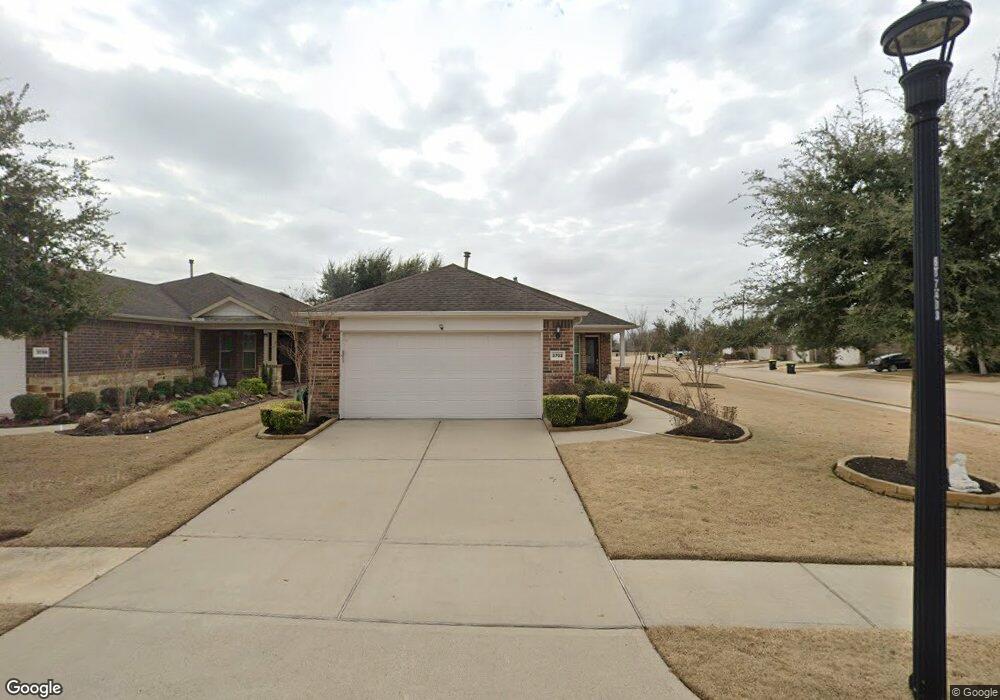
3702 Saddlebag Way Richmond, TX 77469
Estimated Value: $292,959 - $317,000
2
Beds
2
Baths
1,393
Sq Ft
$217/Sq Ft
Est. Value
About This Home
This home is located at 3702 Saddlebag Way, Richmond, TX 77469 and is currently estimated at $302,740, approximately $217 per square foot. 3702 Saddlebag Way is a home located in Fort Bend County with nearby schools including J J Wessendorff Middle School, Lamar Junior High School, and Lamar Consolidated High School.
Ownership History
Date
Name
Owned For
Owner Type
Purchase Details
Closed on
May 16, 2024
Sold by
Chow Christina Kit
Bought by
Chow Damon Tak
Current Estimated Value
Purchase Details
Closed on
Jun 6, 2022
Sold by
Munoz Patricio E and Munoz Tammy E
Bought by
Chow Damon Tak and Chow Christina Kit
Purchase Details
Closed on
Jun 29, 2021
Sold by
Equity Trust Company
Bought by
Munoz Patricio and Munoz Tammy E
Purchase Details
Closed on
Oct 26, 2016
Sold by
Bradford Mildred M and Johnson Anette K
Bought by
Equtiy Trust Compabny and Ann B Punkett Ira
Purchase Details
Closed on
Jul 22, 2016
Sold by
Bradford Jack and Bradford Mildred M
Bought by
Equity Trust Company Fbo Ann B Plunkett Ira
Purchase Details
Closed on
Apr 10, 2015
Sold by
Pulte Homes Of Texas Lp
Bought by
Bradford Jack and Bradford Mildred M
Create a Home Valuation Report for This Property
The Home Valuation Report is an in-depth analysis detailing your home's value as well as a comparison with similar homes in the area
Home Values in the Area
Average Home Value in this Area
Purchase History
| Date | Buyer | Sale Price | Title Company |
|---|---|---|---|
| Chow Damon Tak | -- | None Listed On Document | |
| Chow Damon Tak | -- | Stewart Title | |
| Munoz Patricio | -- | Stewart Title | |
| Equtiy Trust Compabny | -- | Stewart Title | |
| Equity Trust Company Fbo Ann B Plunkett Ira | -- | -- | |
| Equity Trust Company Fbo Ann B Plunkett Ira | -- | -- | |
| Bradford Jack | -- | None Available | |
| Equity Trust Company Fbo Ann B Plunkett Ira | -- | -- |
Source: Public Records
Tax History Compared to Growth
Tax History
| Year | Tax Paid | Tax Assessment Tax Assessment Total Assessment is a certain percentage of the fair market value that is determined by local assessors to be the total taxable value of land and additions on the property. | Land | Improvement |
|---|---|---|---|---|
| 2025 | $2,614 | $306,271 | $48,750 | $257,521 |
| 2024 | $2,614 | $304,041 | $48,750 | $255,291 |
| 2023 | $2,614 | $285,000 | $37,500 | $247,500 |
| 2022 | $7,681 | $268,080 | $37,500 | $230,580 |
| 2021 | $6,415 | $217,090 | $37,500 | $179,590 |
| 2020 | $6,474 | $213,140 | $37,500 | $175,640 |
| 2019 | $6,637 | $205,230 | $37,500 | $167,730 |
| 2018 | $6,672 | $204,100 | $37,500 | $166,600 |
| 2017 | $6,890 | $209,150 | $37,500 | $171,650 |
| 2016 | $7,295 | $221,460 | $37,500 | $183,960 |
| 2015 | $385 | $20,500 | $20,500 | $0 |
| 2014 | $386 | $20,500 | $20,500 | $0 |
Source: Public Records
Map
Nearby Homes
- 3710 Saddlebag Way
- 342 Ranch House Ln
- 3815 County Seat Ln
- 3810 County Seat Ln
- 3623 Paper Birch Dr
- 231 Ranch House Ln
- 3727 Paper Birch Dr
- 234 Cattle Ranch Dr
- 4010 Swallow Tail Way
- 3915 Red Alder Way
- 422 Larkspur Ln
- 1415 Stuart Run Dr
- 1622 Boone Hollow Ln
- 511 Grand Fir Ln
- 23619 Lively Ferry Ln
- 7034 Glennwick Grove Ln
- 1311 Hudgins Pass
- 23611 Lively Ferry Ln
- 1911 Saxon Bend Trail
- 23323 Darst Field Trail
- 3706 Saddlebag Way
- 310 Ranch House Ln
- 3703 Saddlebag Way
- 3714 Saddlebag Way
- 3711 Saddlebag Way
- 326 Ranch House Ln
- 314 Ranch House Ln
- 318 Ranch House Ln
- 3718 Saddlebag Way
- 3703 County Seat Ln
- 322 Ranch House Ln
- 3715 Saddlebag Way
- 3711 County Seat Ln
- 306 Ranch House Ln
- 3715 County Seat Ln
- 3719 County Seat Ln
- 3722 Saddlebag Way
- 3723 County Seat Ln
- 302 Ranch House Ln
- 3719 Saddlebag Way