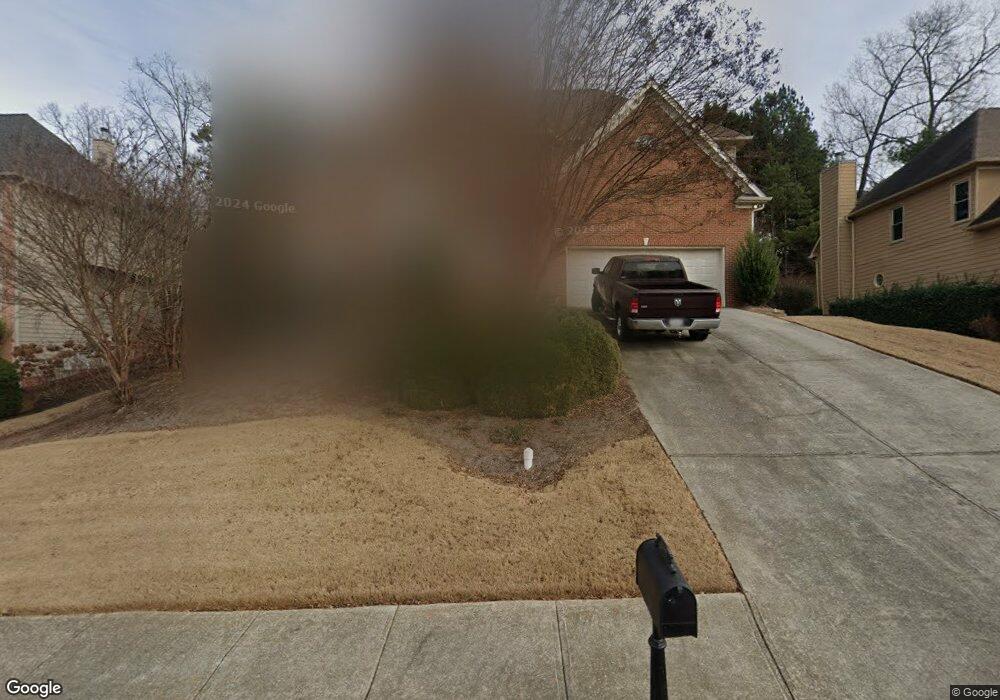
3703 Lake Edge Dr Suwanee, GA 30024
Estimated Value: $713,000 - $799,000
5
Beds
4
Baths
3,537
Sq Ft
$211/Sq Ft
Est. Value
About This Home
This home is located at 3703 Lake Edge Dr, Suwanee, GA 30024 and is currently estimated at $745,251, approximately $210 per square foot. 3703 Lake Edge Dr is a home located in Gwinnett County with nearby schools including Suwanee Elementary School, North Gwinnett Middle School, and North Gwinnett High School.
Ownership History
Date
Name
Owned For
Owner Type
Purchase Details
Closed on
Oct 20, 2010
Sold by
Bac Home Loans Servicing Lp
Bought by
Boyd Pamela D
Current Estimated Value
Home Financials for this Owner
Home Financials are based on the most recent Mortgage that was taken out on this home.
Original Mortgage
$178,400
Outstanding Balance
$117,384
Interest Rate
4.37%
Mortgage Type
New Conventional
Estimated Equity
$627,867
Purchase Details
Closed on
Apr 6, 2010
Sold by
Hacker Douglas E
Bought by
Bac Home Loans Servicing Lp
Purchase Details
Closed on
Nov 12, 1999
Sold by
James Callas Inc
Bought by
Kanageorge James
Home Financials for this Owner
Home Financials are based on the most recent Mortgage that was taken out on this home.
Original Mortgage
$213,400
Interest Rate
7.81%
Mortgage Type
New Conventional
Create a Home Valuation Report for This Property
The Home Valuation Report is an in-depth analysis detailing your home's value as well as a comparison with similar homes in the area
Home Values in the Area
Average Home Value in this Area
Purchase History
| Date | Buyer | Sale Price | Title Company |
|---|---|---|---|
| Boyd Pamela D | $223,000 | -- | |
| Bac Home Loans Servicing Lp | $274,455 | -- | |
| Kanageorge James | $266,800 | -- |
Source: Public Records
Mortgage History
| Date | Status | Borrower | Loan Amount |
|---|---|---|---|
| Open | Boyd Pamela D | $178,400 | |
| Previous Owner | Kanageorge James | $213,400 |
Source: Public Records
Tax History Compared to Growth
Tax History
| Year | Tax Paid | Tax Assessment Tax Assessment Total Assessment is a certain percentage of the fair market value that is determined by local assessors to be the total taxable value of land and additions on the property. | Land | Improvement |
|---|---|---|---|---|
| 2025 | $8,192 | $302,720 | $44,080 | $258,640 |
| 2024 | $6,780 | $224,920 | $46,400 | $178,520 |
| 2023 | $6,780 | $224,920 | $46,400 | $178,520 |
| 2022 | $6,752 | $224,920 | $46,400 | $178,520 |
| 2021 | $5,650 | $167,080 | $34,440 | $132,640 |
| 2020 | $5,689 | $167,080 | $34,440 | $132,640 |
| 2019 | $5,240 | $154,520 | $36,000 | $118,520 |
| 2018 | $5,251 | $154,520 | $36,000 | $118,520 |
| 2016 | $4,788 | $132,440 | $27,200 | $105,240 |
| 2015 | $4,841 | $132,440 | $27,200 | $105,240 |
| 2014 | -- | $132,440 | $27,200 | $105,240 |
Source: Public Records
Map
Nearby Homes
- 407 Vista Lake Dr
- 3713 Lake Edge Dr
- 3720 Brookefall Landing
- 3612 Brookefall Ct
- 366 Regal Pines Ct
- 358 Rhodes House Ct
- 4244 Austin Hills Dr
- 515 Morning Creek Ln
- 325 Morning Mist Walk Unit 2
- 4394 Austin Hills Dr Unit 1
- 3645 Hickory Branch Trail Unit 1
- 3941 Oak Crossing Dr
- 3998 Oak Crossing Dr NE
- 4614 Austin Hills Dr
- 3540 Hickory Branch Trail
- 3740 Crescent Walk Ln
- 3720 Crescent Walk Ln
- 4045 Hillcrest View Ct
- 3693 Lake Edge Dr Unit 2
- 417 Vista Lake Dr
- 3683 Lake Edge Dr
- 3723 Lake Edge Dr
- 3702 Lake Edge Dr Unit 2
- 3712 Lake Edge Dr
- 3692 Lake Edge Dr Unit 2
- 397 Vista Lake Dr
- 427 Vista Lake Dr
- 3722 Lake Edge Dr Unit 2
- 0 Lake Edge Dr Unit 7275313
- 0 Lake Edge Dr Unit 3192885
- 3872 Lake Edge Dr
- 3673 Lake Edge Dr
- 3682 Lake Edge Dr
- 387 Vista Lake Dr
- 3732 Lake Edge Dr Unit 2
- 337 Vista Lake Dr
- 3672 Lake Edge Dr
- 408 Vista Lake Dr