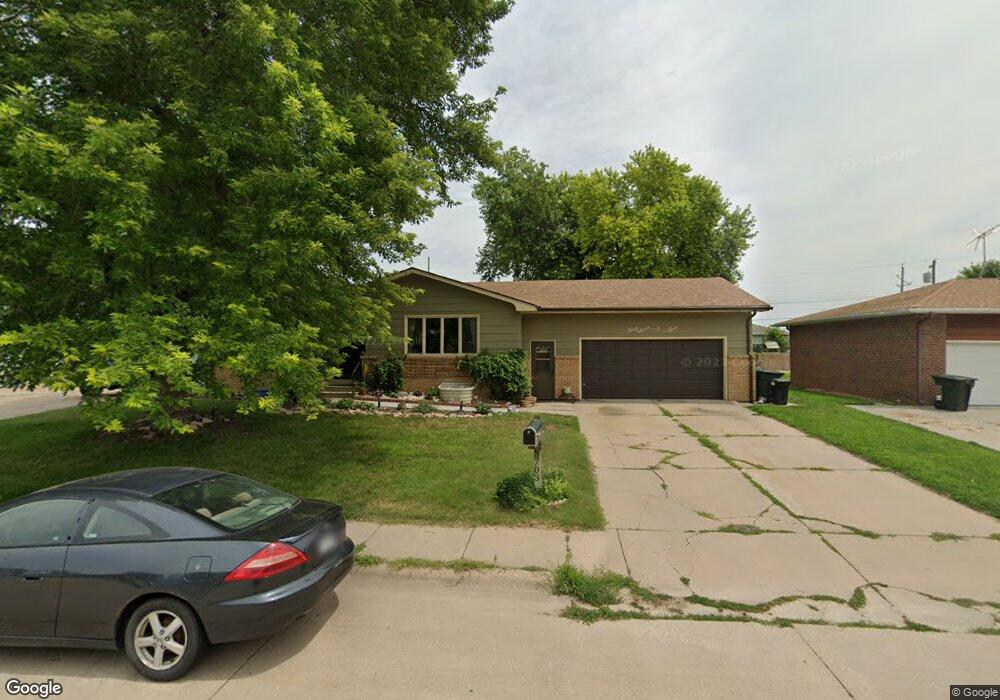
3703 M Ave Kearney, NE 68847
Estimated Value: $273,000 - $293,000
3
Beds
3
Baths
1,188
Sq Ft
$238/Sq Ft
Est. Value
About This Home
This home is located at 3703 M Ave, Kearney, NE 68847 and is currently estimated at $282,599, approximately $237 per square foot. 3703 M Ave is a home located in Buffalo County with nearby schools including Northeast Elementary School, Sunrise Middle School, and Kearney Senior High School.
Ownership History
Date
Name
Owned For
Owner Type
Purchase Details
Closed on
Nov 27, 2023
Sold by
Fasnachte Jason C
Bought by
Briones Tina M
Current Estimated Value
Purchase Details
Closed on
Dec 18, 2013
Sold by
Soffia Soffia
Bought by
Fasnacht Jason C and Briones Tina M
Home Financials for this Owner
Home Financials are based on the most recent Mortgage that was taken out on this home.
Original Mortgage
$152,000
Interest Rate
4.26%
Mortgage Type
Unknown
Create a Home Valuation Report for This Property
The Home Valuation Report is an in-depth analysis detailing your home's value as well as a comparison with similar homes in the area
Home Values in the Area
Average Home Value in this Area
Purchase History
| Date | Buyer | Sale Price | Title Company |
|---|---|---|---|
| Briones Tina M | -- | None Listed On Document | |
| Fasnacht Jason C | $160,000 | Barney |
Source: Public Records
Mortgage History
| Date | Status | Borrower | Loan Amount |
|---|---|---|---|
| Previous Owner | Fasnacht Jason C | $152,000 |
Source: Public Records
Tax History
| Year | Tax Paid | Tax Assessment Tax Assessment Total Assessment is a certain percentage of the fair market value that is determined by local assessors to be the total taxable value of land and additions on the property. | Land | Improvement |
|---|---|---|---|---|
| 2025 | $3,217 | $250,350 | $48,110 | $202,240 |
| 2024 | $3,775 | $229,740 | $46,705 | $183,035 |
| 2023 | $3,775 | $221,815 | $46,705 | $175,110 |
| 2022 | $3,509 | $199,930 | $46,835 | $153,095 |
| 2021 | $3,191 | $185,010 | $43,135 | $141,875 |
| 2020 | $3,174 | $183,485 | $41,610 | $141,875 |
| 2019 | $3,171 | $181,110 | $41,435 | $139,675 |
| 2018 | $3,066 | $177,635 | $34,520 | $143,115 |
| 2017 | $2,815 | $164,185 | $34,520 | $129,665 |
| 2016 | $2,792 | $164,185 | $34,520 | $129,665 |
| 2015 | $2,710 | $155,785 | $0 | $0 |
| 2014 | $2,565 | $134,530 | $0 | $0 |
Source: Public Records
Map
Nearby Homes
Your Personal Tour Guide
Ask me questions while you tour the home.