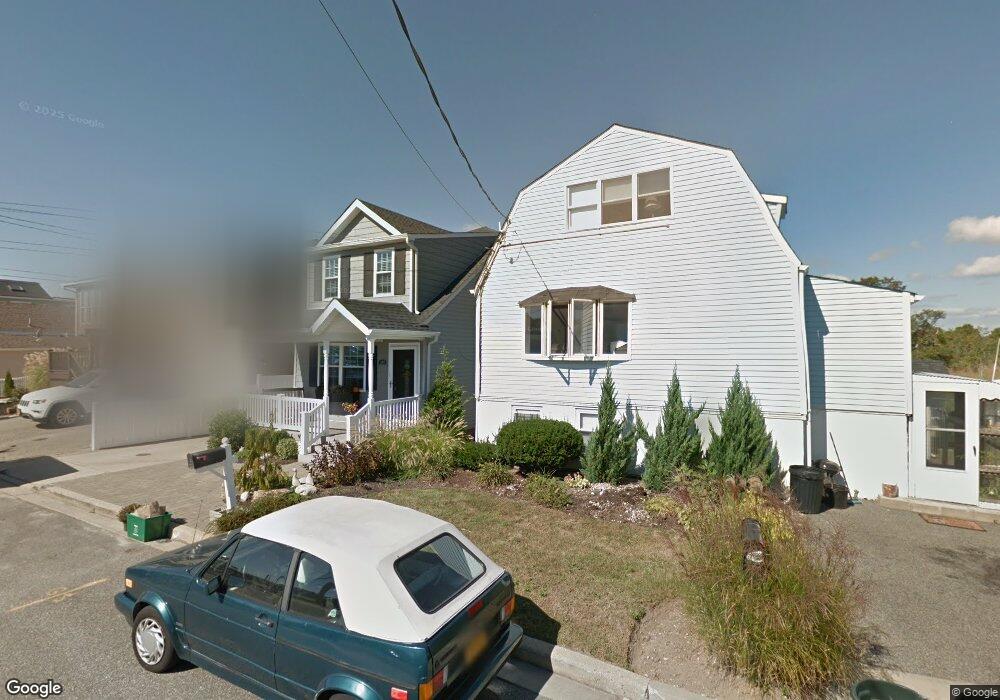
3703 Nimrod St Seaford, NY 11783
Estimated Value: $572,640 - $713,000
2
Beds
2
Baths
1,168
Sq Ft
$550/Sq Ft
Est. Value
About This Home
This home is located at 3703 Nimrod St, Seaford, NY 11783 and is currently estimated at $642,820, approximately $550 per square foot. 3703 Nimrod St is a home located in Nassau County with nearby schools including Seaford Middle School, Seaford Senior High School, and Maplewood School.
Ownership History
Date
Name
Owned For
Owner Type
Purchase Details
Closed on
Apr 1, 2022
Sold by
Murphy Margaret
Bought by
Murphy Christopher S and Margaret Murphy Irrevocable Family Trust
Current Estimated Value
Purchase Details
Closed on
Jan 21, 2015
Sold by
Riddle Jeremy and Johnson Savrena
Bought by
Murphy Margaret
Purchase Details
Closed on
Jun 14, 2007
Sold by
Barone Anthony
Bought by
Riddle Jeremy
Purchase Details
Closed on
Jul 10, 2002
Sold by
Horne Irene
Bought by
Barone Anthony
Purchase Details
Closed on
Nov 25, 1998
Sold by
Borgese Ronald
Bought by
Horne Irene
Purchase Details
Closed on
Aug 22, 1995
Sold by
Burgess Charles
Bought by
Borgese Ronald
Home Financials for this Owner
Home Financials are based on the most recent Mortgage that was taken out on this home.
Original Mortgage
$133,436
Interest Rate
7.32%
Create a Home Valuation Report for This Property
The Home Valuation Report is an in-depth analysis detailing your home's value as well as a comparison with similar homes in the area
Home Values in the Area
Average Home Value in this Area
Purchase History
| Date | Buyer | Sale Price | Title Company |
|---|---|---|---|
| Murphy Christopher S | -- | None Available | |
| Murphy Margaret | $390,000 | None Available | |
| Riddle Jeremy | $465,000 | -- | |
| Barone Anthony | $327,500 | -- | |
| Horne Irene | $180,000 | -- | |
| Borgese Ronald | $140,000 | -- |
Source: Public Records
Mortgage History
| Date | Status | Borrower | Loan Amount |
|---|---|---|---|
| Previous Owner | Borgese Ronald | $133,436 |
Source: Public Records
Tax History Compared to Growth
Tax History
| Year | Tax Paid | Tax Assessment Tax Assessment Total Assessment is a certain percentage of the fair market value that is determined by local assessors to be the total taxable value of land and additions on the property. | Land | Improvement |
|---|---|---|---|---|
| 2025 | $11,436 | $414 | $140 | $274 |
| 2024 | $2,534 | $416 | $141 | $275 |
| 2023 | $10,650 | $440 | $148 | $292 |
| 2022 | $10,650 | $432 | $146 | $286 |
| 2021 | $9,734 | $438 | $148 | $290 |
| 2020 | $9,307 | $546 | $545 | $1 |
| 2019 | $2,594 | $585 | $584 | $1 |
| 2018 | $7,005 | $624 | $0 | $0 |
| 2017 | $7,391 | $663 | $661 | $2 |
| 2016 | $10,117 | $814 | $811 | $3 |
| 2015 | $3,317 | $814 | $811 | $3 |
| 2014 | $3,317 | $814 | $811 | $3 |
| 2013 | $3,111 | $814 | $811 | $3 |
Source: Public Records
Map
Nearby Homes
- 3692 Ocean Ave
- 3651 Marinor St
- 3695 Somerset Dr
- 3717 Somerset Dr
- 3609 Somerset Dr
- 2905 Ocean Ave
- 7 Crescent Cove Dr
- 220 Shore Rd
- 2701 S Seamans Neck Rd
- 3570 Plover Place
- 2573 Harvard Ln
- 2655 Ocean Ave
- 2601 Ocean Ave
- 0 Island Place Unit 3107575
- 75 Forest Ave
- 3663 Roanoke St
- 94 Forest Ave
- 2437 Archer St
- 65 Jefferson Place
- 3495 Roanoke St
- 3723 Ocean Ave
- 2723 Ocean Ave
- 3699 Nimrod St
- 3691 Nimrod St
- 3687 Nimrod St
- 3720 Ocean Ave
- 3720 Ocean Ave Unit B
- 3690 Nimrod St
- 3685 Nimrod St
- 3726 Ocean Ave
- 3716 Ocean Ave
- 3686 Naomi St
- 3686 Naomi St
- 3710 Ocean Ave
- 3684 Nimrod St
- 3677 Nimrod St
- 3708 Ocean Ave
- 3680 Naomi St
- 3678 Nimrod St
- 3675 Nimrod St