3703 Osprey Ct SE Concord, NC 28025
Estimated Value: $312,666 - $345,000
3
Beds
2
Baths
1,335
Sq Ft
$249/Sq Ft
Est. Value
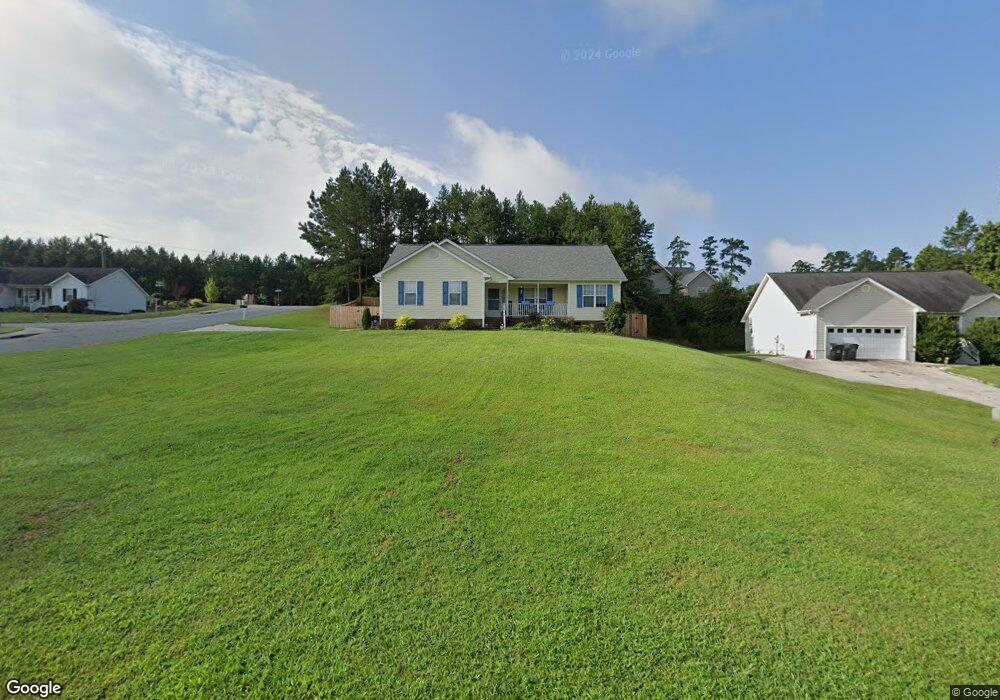
About This Home
This home is located at 3703 Osprey Ct SE, Concord, NC 28025 and is currently estimated at $332,417, approximately $249 per square foot. 3703 Osprey Ct SE is a home located in Cabarrus County with nearby schools including W.M. Irvin Elementary School, Mount Pleasant Middle School, and Mount Pleasant High School.
Ownership History
Date
Name
Owned For
Owner Type
Purchase Details
Closed on
May 23, 2022
Sold by
Floyd Hough Leonard
Bought by
Hough Leonard Floyd and Schweitzer-Hough Ambre Lynn
Current Estimated Value
Home Financials for this Owner
Home Financials are based on the most recent Mortgage that was taken out on this home.
Original Mortgage
$182,969
Outstanding Balance
$173,817
Interest Rate
5.25%
Mortgage Type
New Conventional
Estimated Equity
$158,600
Purchase Details
Closed on
May 9, 2008
Sold by
Summit Co Inc
Bought by
Hough Leonard Floyd and Schweitzer Ambre Lynn
Home Financials for this Owner
Home Financials are based on the most recent Mortgage that was taken out on this home.
Original Mortgage
$135,867
Interest Rate
5.82%
Mortgage Type
FHA
Create a Home Valuation Report for This Property
The Home Valuation Report is an in-depth analysis detailing your home's value as well as a comparison with similar homes in the area
Home Values in the Area
Average Home Value in this Area
Purchase History
| Date | Buyer | Sale Price | Title Company |
|---|---|---|---|
| Hough Leonard Floyd | -- | Rosenberg Jay A | |
| Hough Leonard Floyd | -- | None Listed On Document | |
| Hough Leonard Floyd | $138,000 | None Available |
Source: Public Records
Mortgage History
| Date | Status | Borrower | Loan Amount |
|---|---|---|---|
| Open | Hough Leonard Floyd | $182,969 | |
| Closed | Hough Leonard Floyd | $182,969 | |
| Previous Owner | Hough Leonard Floyd | $135,867 |
Source: Public Records
Tax History Compared to Growth
Tax History
| Year | Tax Paid | Tax Assessment Tax Assessment Total Assessment is a certain percentage of the fair market value that is determined by local assessors to be the total taxable value of land and additions on the property. | Land | Improvement |
|---|---|---|---|---|
| 2025 | $2,970 | $298,190 | $65,000 | $233,190 |
| 2024 | $2,970 | $298,190 | $65,000 | $233,190 |
| 2023 | $2,017 | $165,340 | $35,000 | $130,340 |
| 2022 | $2,017 | $165,340 | $35,000 | $130,340 |
| 2021 | $2,017 | $165,340 | $35,000 | $130,340 |
| 2020 | $2,017 | $165,340 | $35,000 | $130,340 |
| 2019 | $1,666 | $136,560 | $15,000 | $121,560 |
| 2018 | $1,639 | $136,560 | $15,000 | $121,560 |
| 2017 | $1,611 | $136,560 | $15,000 | $121,560 |
| 2016 | $956 | $127,400 | $28,000 | $99,400 |
| 2015 | $1,503 | $127,400 | $28,000 | $99,400 |
| 2014 | $1,503 | $127,400 | $28,000 | $99,400 |
Source: Public Records
Map
Nearby Homes
- 1695 Lemming Dr
- 1665 Red Bird Cir
- 1300 Hess Rd
- 2911 Buffalo Hills Dr
- 1930 Cold Springs Rd
- 2314 Fairport Dr SE
- 2817 Allendale Ct
- 2365 Baxter Place SE
- 2369 Baxter Place SE
- 2625 Old Airport Rd
- 1508 Thompson Dr
- 5200 Fieldstone Dr
- 3261 Fairmead Dr
- 1146 Crestmont Dr SE
- 2909 Arbor Knoll
- 1076 Tangle Ridge Dr SE
- 3109 Fairmead Dr
- 1128 Tangle Ridge Dr SE
- 2406 Everton Cir SE
- 4240 Nc Hwy 73 None E
- 3707 Osprey Ct SE
- 3697 Old Airport Rd
- 3693 Old Airport Rd
- 1621 Red Bird Cir
- 496 Kacys Way Place SE
- 499 Kacys Way Place SE
- 491 Kacys Way Place SE
- 3699 Red Bird Cir
- 1806 Red Bird Cir Unit 73
- 1807 Red Bird Cir
- 3689 Old Airport Rd
- 3704 Osprey Ct SE
- 3708 Osprey Ct SE
- 3711 Osprey Ct SE
- 1620 Red Bird Cir
- 3685 Old Airport Rd
- 1803 Red Bird Cir
- 1625 Red Bird Cir
- 1624 Red Bird Cir
- 3681 Old Airport Rd