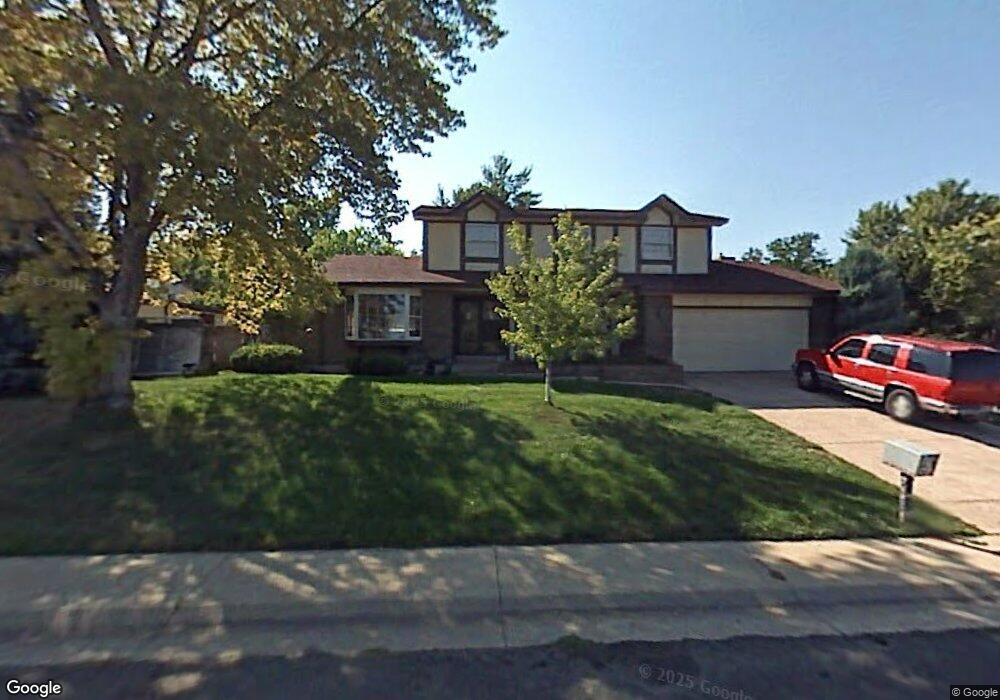
3703 S Xenia St Denver, CO 80237
Hampden South NeighborhoodEstimated Value: $680,000 - $864,000
4
Beds
3
Baths
2,309
Sq Ft
$320/Sq Ft
Est. Value
About This Home
This home is located at 3703 S Xenia St, Denver, CO 80237 and is currently estimated at $739,601, approximately $320 per square foot. 3703 S Xenia St is a home located in Denver County with nearby schools including Holm Elementary School, Samuels Elementary School, and Joe Shoemaker School.
Ownership History
Date
Name
Owned For
Owner Type
Purchase Details
Closed on
Oct 31, 1994
Sold by
Ioannides Nicolaos C and Ioannides Faith K
Bought by
Duncan Kevin Paul and Duncan Patricia M
Current Estimated Value
Home Financials for this Owner
Home Financials are based on the most recent Mortgage that was taken out on this home.
Original Mortgage
$142,300
Interest Rate
7.5%
Create a Home Valuation Report for This Property
The Home Valuation Report is an in-depth analysis detailing your home's value as well as a comparison with similar homes in the area
Home Values in the Area
Average Home Value in this Area
Purchase History
| Date | Buyer | Sale Price | Title Company |
|---|---|---|---|
| Duncan Kevin Paul | $158,150 | -- |
Source: Public Records
Mortgage History
| Date | Status | Borrower | Loan Amount |
|---|---|---|---|
| Closed | Duncan Kevin Paul | $142,300 |
Source: Public Records
Tax History Compared to Growth
Tax History
| Year | Tax Paid | Tax Assessment Tax Assessment Total Assessment is a certain percentage of the fair market value that is determined by local assessors to be the total taxable value of land and additions on the property. | Land | Improvement |
|---|---|---|---|---|
| 2024 | $3,324 | $41,970 | $11,530 | $30,440 |
| 2023 | $3,252 | $41,970 | $11,530 | $30,440 |
| 2022 | $2,799 | $35,190 | $15,780 | $19,410 |
| 2021 | $2,702 | $36,210 | $16,240 | $19,970 |
| 2020 | $2,359 | $31,790 | $16,240 | $15,550 |
| 2019 | $2,293 | $31,790 | $16,240 | $15,550 |
| 2018 | $2,079 | $26,870 | $16,350 | $10,520 |
| 2017 | $2,073 | $26,870 | $16,350 | $10,520 |
| 2016 | $2,162 | $26,510 | $15,952 | $10,558 |
| 2015 | $2,071 | $26,510 | $15,952 | $10,558 |
| 2014 | $1,864 | $22,440 | $7,164 | $15,276 |
Source: Public Records
Map
Nearby Homes
- 8709 E Kenyon Ave
- 9255 E Lehigh Ave Unit 194
- 9005 E Lehigh Ave Unit 19
- 9105 E Lehigh Ave Unit 74
- 9149 E Mansfield Ave
- 9240 E Lehigh Ave Unit 20
- 8500 E Jefferson Ave Unit B
- 8500 E Jefferson Ave Unit 16B
- 8500 E Jefferson Ave Unit 11C
- 8500 E Jefferson Ave Unit 17C
- 8500 E Jefferson Ave Unit 7
- 8500 E Jefferson Ave Unit 3C
- 8329 E Kenyon Ave
- 9133 E Mansfield Ave Unit 81
- 9145 E Mansfield Ave
- 9032 E Mansfield Ave Unit 404
- 8299 E Kenyon Ave
- 8711 E Hampden Ave Unit 21
- 8711 E Hampden Ave Unit 28
- 9252 E Mansfield Ave Unit 240
- 8791 E Kent Place
- 8740 E Kenyon Ave
- 8751 E Kent Place
- 8769 E Kenyon Ave
- 3704 S Xenia St
- 8799 E Kenyon Ave
- 8739 E Kenyon Ave
- 3724 S Xenia St
- 8809 E Kenyon Ave
- 3754 S Xenia St
- 8710 E Kenyon Ave
- 3648 S Xenia Ct
- 8701 E Kent Place
- 3641 S Xenia St
- 8792 E Kent Place
- 3644 S Xenia Ct
- 8752 E Kent Place
- 3637 S Xenia St
- 3764 S Xenia St
- 3633 S Xenia St