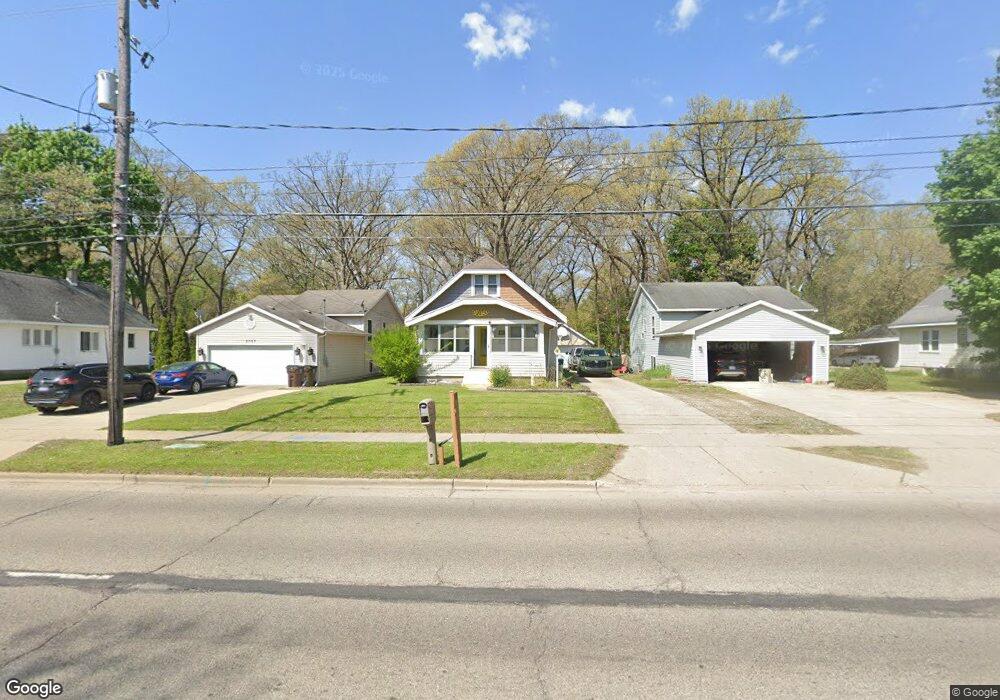
3705 Burlingame Ave SW Wyoming, MI 49509
Estimated Value: $250,000 - $305,000
3
Beds
3
Baths
2,370
Sq Ft
$118/Sq Ft
Est. Value
About This Home
This home is located at 3705 Burlingame Ave SW, Wyoming, MI 49509 and is currently estimated at $280,032, approximately $118 per square foot. 3705 Burlingame Ave SW is a home located in Kent County with nearby schools including Oriole Park Elementary School, West Elementary School, and Gladiola Elementary School.
Ownership History
Date
Name
Owned For
Owner Type
Purchase Details
Closed on
Apr 11, 2011
Sold by
Westparke Inc
Bought by
Meunier Josh
Current Estimated Value
Home Financials for this Owner
Home Financials are based on the most recent Mortgage that was taken out on this home.
Original Mortgage
$76,002
Outstanding Balance
$52,312
Interest Rate
4.75%
Mortgage Type
FHA
Estimated Equity
$227,720
Purchase Details
Closed on
Aug 18, 2010
Sold by
Rierson Steven E and Bruno Reinaldo
Bought by
Westparke Inc
Purchase Details
Closed on
Jul 21, 2010
Sold by
Rierson Steven E and Bruno Reinaldo
Bought by
Westparke Inc
Purchase Details
Closed on
Jul 29, 2003
Sold by
Brunsink James and Brunsink Jennifer
Bought by
Rierson Steven E and Bruno Reinaldo
Home Financials for this Owner
Home Financials are based on the most recent Mortgage that was taken out on this home.
Original Mortgage
$100,000
Interest Rate
5.74%
Mortgage Type
Purchase Money Mortgage
Purchase Details
Closed on
Nov 24, 1997
Create a Home Valuation Report for This Property
The Home Valuation Report is an in-depth analysis detailing your home's value as well as a comparison with similar homes in the area
Home Values in the Area
Average Home Value in this Area
Purchase History
| Date | Buyer | Sale Price | Title Company |
|---|---|---|---|
| Meunier Josh | $78,000 | Chicago Title | |
| Westparke Inc | -- | None Available | |
| Westparke Inc | $32,501 | None Available | |
| Rierson Steven E | $125,000 | -- | |
| Brunsink James | $85,000 | -- | |
| -- | $85,000 | -- |
Source: Public Records
Mortgage History
| Date | Status | Borrower | Loan Amount |
|---|---|---|---|
| Open | Meunier Josh | $76,002 | |
| Previous Owner | Rierson Steven E | $100,000 | |
| Closed | Rierson Steven E | $25,000 |
Source: Public Records
Tax History Compared to Growth
Tax History
| Year | Tax Paid | Tax Assessment Tax Assessment Total Assessment is a certain percentage of the fair market value that is determined by local assessors to be the total taxable value of land and additions on the property. | Land | Improvement |
|---|---|---|---|---|
| 2025 | $2,201 | $131,300 | $0 | $0 |
| 2024 | $2,201 | $118,600 | $0 | $0 |
| 2023 | $2,276 | $106,400 | $0 | $0 |
| 2022 | $2,124 | $88,800 | $0 | $0 |
| 2021 | $2,047 | $82,800 | $0 | $0 |
| 2020 | $1,868 | $77,300 | $0 | $0 |
| 2019 | $1,793 | $70,700 | $0 | $0 |
| 2018 | $1,965 | $65,100 | $0 | $0 |
| 2017 | $2,761 | $55,000 | $0 | $0 |
| 2016 | $1,848 | $49,200 | $0 | $0 |
| 2015 | $1,826 | $49,200 | $0 | $0 |
| 2013 | -- | $44,800 | $0 | $0 |
Source: Public Records
Map
Nearby Homes
- 3756 Minnie Ave SW
- 1534 Beech St SW
- 3983 Burlingame Ave SW
- 4032 Oriole Ave SW
- 3630 Raven Ave SW
- 3817 Taft Ave SW
- 1277 Oakcrest St SW
- 1752 Plas St SW
- 3500 Raven Ave SW
- 3572 Flamingo Ave SW
- 3252 Taft Ave SW
- 4068 Flamingo Ave SW
- 3921 Colby Ave SW
- 4015 Milan Ave SW
- 1061 35th St SW
- 1731 32nd St SW Unit 1733
- 4190 Heron Ave SW
- 4016 Milan Ave SW
- 4128 Michael Ave SW
- 1023 Ariebill St SW
- 3707 Burlingame Ave SW
- 3701 Burlingame Ave SW
- 3639 Burlingame Ave SW
- 3635 Burlingame Ave SW
- 0 Burlingame Ave SW
- 30323034 Burlingame Ave SW
- 5971 Burlingame Ave SW Unit 6021
- 5615 Burlingame Ave SW
- 6590 Burlingame Ave SW
- 3715 Burlingame Ave SW
- 3700 Minnie Ave SW
- 3631 Burlingame Ave SW
- 3716 Minnie Ave SW
- 3636 Minnie Ave SW
- 3704 Burlingame Ave SW
- 3708 Burlingame Ave SW
- 3726 Minnie Ave SW
- 3630 Minnie Ave SW
- 3623 Burlingame Ave SW
- 3638 Burlingame Ave SW