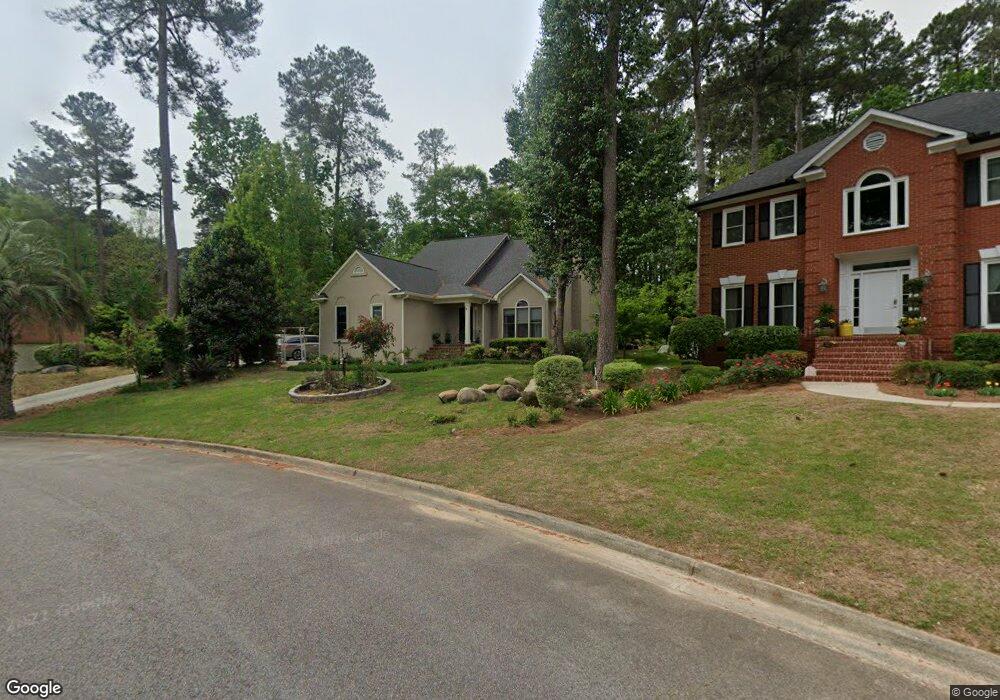
3705 Clark Crossing Augusta, GA 30907
Estimated Value: $368,509 - $425,000
4
Beds
3
Baths
2,734
Sq Ft
$142/Sq Ft
Est. Value
About This Home
This home is located at 3705 Clark Crossing, Augusta, GA 30907 and is currently estimated at $387,127, approximately $141 per square foot. 3705 Clark Crossing is a home located in Columbia County with nearby schools including Stevens Creek Elementary School, Stallings Island Middle School, and Lakeside High School.
Ownership History
Date
Name
Owned For
Owner Type
Purchase Details
Closed on
Apr 30, 2008
Sold by
Rhodes Marc A
Bought by
Mohan Monica
Current Estimated Value
Home Financials for this Owner
Home Financials are based on the most recent Mortgage that was taken out on this home.
Original Mortgage
$209,600
Outstanding Balance
$132,009
Interest Rate
5.86%
Mortgage Type
New Conventional
Estimated Equity
$255,118
Purchase Details
Closed on
Jun 15, 2001
Sold by
Laska Gene H and Laska Frances P
Bought by
Rhodes Marc A and Rhodes Linda P
Home Financials for this Owner
Home Financials are based on the most recent Mortgage that was taken out on this home.
Original Mortgage
$167,400
Interest Rate
7.14%
Create a Home Valuation Report for This Property
The Home Valuation Report is an in-depth analysis detailing your home's value as well as a comparison with similar homes in the area
Home Values in the Area
Average Home Value in this Area
Purchase History
| Date | Buyer | Sale Price | Title Company |
|---|---|---|---|
| Mohan Monica | $262,000 | -- | |
| Rhodes Marc A | $186,000 | -- |
Source: Public Records
Mortgage History
| Date | Status | Borrower | Loan Amount |
|---|---|---|---|
| Open | Mohan Monica | $209,600 | |
| Previous Owner | Rhodes Marc A | $167,400 |
Source: Public Records
Tax History
| Year | Tax Paid | Tax Assessment Tax Assessment Total Assessment is a certain percentage of the fair market value that is determined by local assessors to be the total taxable value of land and additions on the property. | Land | Improvement |
|---|---|---|---|---|
| 2025 | $3,404 | $140,282 | $28,804 | $111,478 |
| 2024 | $3,713 | $146,275 | $28,804 | $117,471 |
| 2023 | $3,713 | $131,852 | $27,204 | $104,648 |
| 2022 | $3,187 | $120,408 | $25,004 | $95,404 |
| 2021 | $2,911 | $104,930 | $21,104 | $83,826 |
| 2020 | $2,703 | $95,243 | $19,604 | $75,639 |
| 2019 | $2,638 | $92,920 | $19,804 | $73,116 |
| 2018 | $2,720 | $95,534 | $19,304 | $76,230 |
| 2017 | $2,610 | $91,259 | $18,704 | $72,555 |
| 2016 | $2,516 | $91,176 | $19,380 | $71,796 |
| 2015 | $2,400 | $86,725 | $18,780 | $67,945 |
| 2014 | $2,224 | $79,188 | $17,180 | $62,008 |
Source: Public Records
Map
Nearby Homes
- 391 Bakers Ferry Trail
- 3766 Roscommon S
- 343 Joshua Tree Dr
- 3750 Roscommon S
- 3748 Tailboard Way
- 3641 Lake Shore Dr
- 497 Creekwalk Cir
- 513 Crystal Creek W
- 535 Crystal Creek E
- 317 Furys Ferry Rd
- 429 Wexford Ct
- 318 Stagecoach Way
- 3765 Silver Mine Bluff
- 499 Crystal Creek W
- 3742 Overland Cutoff
- 3777 Pine Ridge Run
- 3829 Villa Ln
- 500 Oak Chase Dr
- 3832 Forest Creek Way
- 499 Oak Chase Dr
- 3707 Clark Crossing
- 3703 Clark Crossing
- 3681 El Cordero Ranch Springs Rd
- 401 Bakers Ferry Trail
- 3675 El Cordero Ranch Springs Rd
- 403 Bakers Ferry Trail
- 399 Bakers Ferry Trail
- 3677 El Cordero Ranch Springs Rd
- 3704 Clark Crossing
- 3675 El Cordero Ranch Springs Rd
- 3709 Clark Crossing
- 3702 Clark Crossing
- 405 Bakers Ferry Trail
- 397 Bakers Ferry Trail
- 3706 Clark Crossing
- 3686 El Cordero Ranch Springs Rd
- 407 Bakers Ferry Trail
- 3711 Clark Crossing
- 3695 El Cordero Ranch Springs Rd
- 3688 El Cordero Ranch Springs Rd