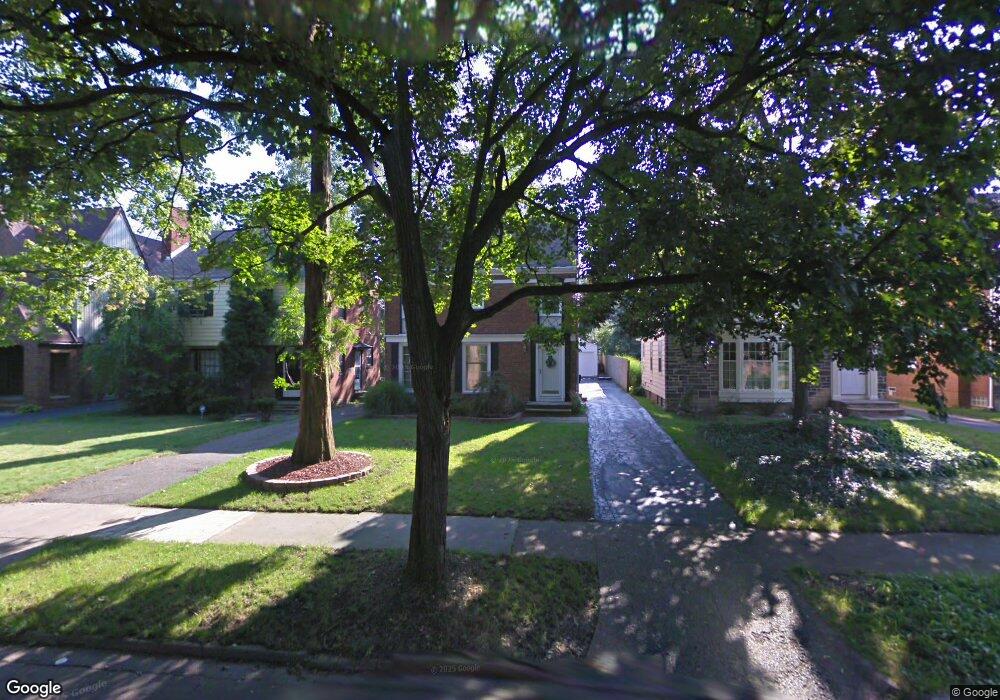
3705 Glencairn Rd Shaker Heights, OH 44122
Estimated Value: $266,000 - $284,000
4
Beds
3
Baths
1,512
Sq Ft
$182/Sq Ft
Est. Value
About This Home
This home is located at 3705 Glencairn Rd, Shaker Heights, OH 44122 and is currently estimated at $275,780, approximately $182 per square foot. 3705 Glencairn Rd is a home located in Cuyahoga County with nearby schools including Lomond Elementary School, Woodbury Elementary School, and Shaker Heights Middle School.
Ownership History
Date
Name
Owned For
Owner Type
Purchase Details
Closed on
Jun 23, 2005
Sold by
Poe Brian and Poe Beth
Bought by
Scott Corey and Scott Sabrina
Current Estimated Value
Home Financials for this Owner
Home Financials are based on the most recent Mortgage that was taken out on this home.
Original Mortgage
$142,000
Outstanding Balance
$74,085
Interest Rate
5.75%
Mortgage Type
Fannie Mae Freddie Mac
Estimated Equity
$201,695
Purchase Details
Closed on
Jun 2, 2000
Sold by
Dickerman Richard C and Dickerman L M
Bought by
Poe Brian and Poe Beth
Home Financials for this Owner
Home Financials are based on the most recent Mortgage that was taken out on this home.
Original Mortgage
$139,000
Interest Rate
8.66%
Mortgage Type
Seller Take Back
Purchase Details
Closed on
Jan 1, 1975
Bought by
Dickerman Richard C and L M
Create a Home Valuation Report for This Property
The Home Valuation Report is an in-depth analysis detailing your home's value as well as a comparison with similar homes in the area
Home Values in the Area
Average Home Value in this Area
Purchase History
| Date | Buyer | Sale Price | Title Company |
|---|---|---|---|
| Scott Corey | $178,000 | Progressive Land Title Ag | |
| Poe Brian | $140,000 | Erie Title Agency Inc | |
| Dickerman Richard C | -- | -- |
Source: Public Records
Mortgage History
| Date | Status | Borrower | Loan Amount |
|---|---|---|---|
| Open | Scott Corey | $142,000 | |
| Previous Owner | Poe Brian | $139,000 |
Source: Public Records
Tax History Compared to Growth
Tax History
| Year | Tax Paid | Tax Assessment Tax Assessment Total Assessment is a certain percentage of the fair market value that is determined by local assessors to be the total taxable value of land and additions on the property. | Land | Improvement |
|---|---|---|---|---|
| 2024 | $7,213 | $80,780 | $14,630 | $66,150 |
| 2023 | $6,857 | $60,870 | $10,990 | $49,880 |
| 2022 | $6,663 | $60,870 | $10,990 | $49,880 |
| 2021 | $6,640 | $60,870 | $10,990 | $49,880 |
| 2020 | $6,416 | $55,300 | $9,980 | $45,330 |
| 2019 | $6,323 | $158,000 | $28,500 | $129,500 |
| 2018 | $6,360 | $55,300 | $9,980 | $45,330 |
| 2017 | $6,193 | $51,210 | $8,610 | $42,600 |
| 2016 | $5,945 | $51,210 | $8,610 | $42,600 |
| 2015 | $6,043 | $51,210 | $8,610 | $42,600 |
| 2014 | $6,043 | $50,200 | $8,440 | $41,760 |
Source: Public Records
Map
Nearby Homes
- 3717 Gridley Rd
- 18107 Scottsdale Blvd
- 18112 Lomond Blvd
- 3656 Latimore Rd
- 3710 Strandhill Rd
- 3698 Strandhill Rd
- 18117 Lomond Blvd
- 3638 Glencairn Rd
- 17725 Scottsdale Blvd
- 18515 Lomond Blvd
- 3575 Gridley Rd
- 3633 Ingleside Rd
- 17429 Scottsdale Blvd
- 3853 Lee Heights Blvd
- 17511 Throckley Ave
- 17422 Lomond Blvd
- 18413 Newell Rd
- 17426 Invermere Ave
- 3683 Stoer Rd
- 18431 Newell Rd
- 3701 Glencairn Rd
- 3709 Glencairn Rd
- 3697 Glencairn Rd
- 3713 Glencairn Rd
- 3693 Glencairn Rd
- 3717 Glencairn Rd
- 3706 Gridley Rd
- 3702 Gridley Rd
- 3710 Gridley Rd Unit Down
- 3710 Gridley Rd Unit UP
- 3710 Gridley Rd
- 3689 Glencairn Rd
- 3698 Gridley Rd
- 3714 Gridley Rd
- 3714 Gridley Rd Unit 2
- 3721 Glencairn Rd
- 3694 Gridley Rd
- 3718 Gridley Rd
- 3718 3720 Gridley Rd
- 3720 Gridley Rd