Estimated Value: $198,973 - $251,000
4
Beds
2
Baths
1,789
Sq Ft
$130/Sq Ft
Est. Value
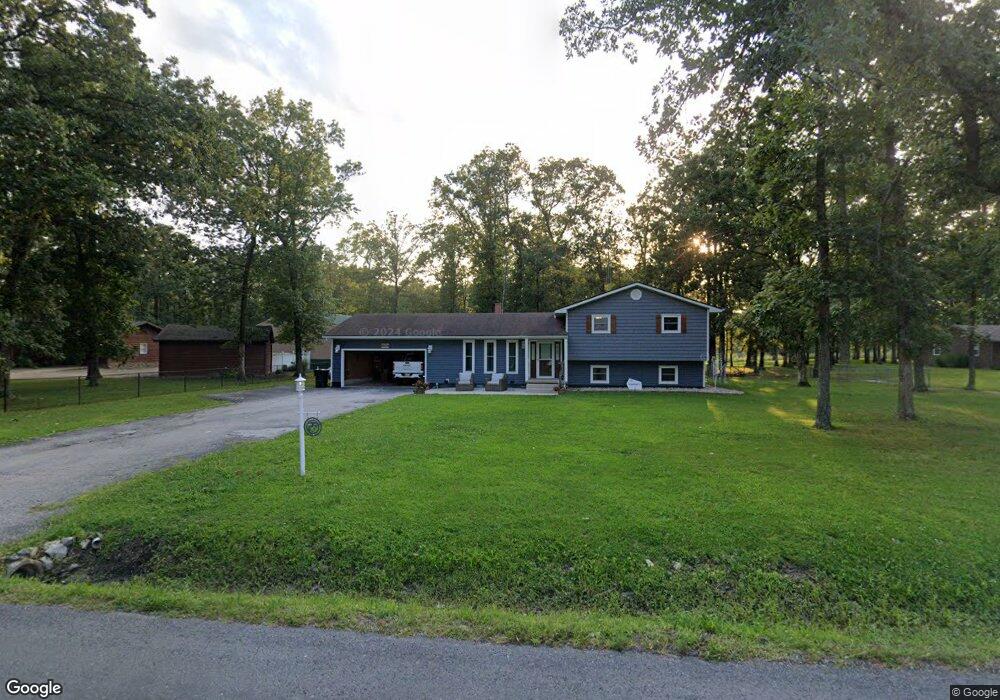
About This Home
This home is located at 3705 Hotze Rd, Salem, IL 62881 and is currently estimated at $233,243, approximately $130 per square foot. 3705 Hotze Rd is a home located in Marion County with nearby schools including Selmaville Elementary School, Salem Community High School, and St. Theresa Elementary School.
Ownership History
Date
Name
Owned For
Owner Type
Purchase Details
Closed on
Nov 23, 2021
Sold by
Szopinski Jared
Bought by
Szopinski Jared and Szopinski Kristin
Current Estimated Value
Home Financials for this Owner
Home Financials are based on the most recent Mortgage that was taken out on this home.
Original Mortgage
$139,500
Outstanding Balance
$127,396
Interest Rate
2.75%
Mortgage Type
VA
Estimated Equity
$105,847
Purchase Details
Closed on
Jan 4, 2017
Sold by
Jourdan David T and Jourdan Deborah J
Bought by
Szopinski Jared
Home Financials for this Owner
Home Financials are based on the most recent Mortgage that was taken out on this home.
Original Mortgage
$115,000
Interest Rate
4.03%
Mortgage Type
VA
Purchase Details
Closed on
Feb 7, 2006
Sold by
Steinkamp Julia B
Bought by
Jourdan David T
Home Financials for this Owner
Home Financials are based on the most recent Mortgage that was taken out on this home.
Original Mortgage
$119,995
Interest Rate
9.75%
Mortgage Type
Adjustable Rate Mortgage/ARM
Create a Home Valuation Report for This Property
The Home Valuation Report is an in-depth analysis detailing your home's value as well as a comparison with similar homes in the area
Home Values in the Area
Average Home Value in this Area
Purchase History
| Date | Buyer | Sale Price | Title Company |
|---|---|---|---|
| Szopinski Jared | -- | None Available | |
| Szopinski Jared | $115,000 | Illinois Real Estate Service | |
| Jourdan David T | $60,000 | None Available |
Source: Public Records
Mortgage History
| Date | Status | Borrower | Loan Amount |
|---|---|---|---|
| Open | Szopinski Jared | $139,500 | |
| Closed | Szopinski Jared | $115,000 | |
| Previous Owner | Jourdan David T | $119,995 |
Source: Public Records
Tax History Compared to Growth
Tax History
| Year | Tax Paid | Tax Assessment Tax Assessment Total Assessment is a certain percentage of the fair market value that is determined by local assessors to be the total taxable value of land and additions on the property. | Land | Improvement |
|---|---|---|---|---|
| 2024 | -- | $53,260 | $3,640 | $49,620 |
| 2023 | -- | $49,770 | $3,400 | $46,370 |
| 2022 | $0 | $45,240 | $3,090 | $42,150 |
| 2021 | $0 | $42,280 | $2,890 | $39,390 |
| 2020 | $2,427 | $41,960 | $2,870 | $39,090 |
| 2019 | $2,427 | $40,420 | $2,760 | $37,660 |
| 2018 | $2,427 | $40,420 | $2,760 | $37,660 |
| 2017 | $2,389 | $39,630 | $2,710 | $36,920 |
| 2016 | $2,707 | $37,390 | $2,560 | $34,830 |
| 2015 | $26 | $37,390 | $2,560 | $34,830 |
| 2012 | $25 | $37,120 | $2,500 | $34,620 |
Source: Public Records
Map
Nearby Homes
- 3638 Hotze Rd
- 3614 S Hotze Rd
- 3946 Hester Ln
- 2019 W Main St
- 130 N Hotze Rd
- 2022 W Main St
- Lot 12 Cross Creek Blvd
- 1355 College Ave
- 3073 Hotze Rd
- 222 Westport Dr
- 437 Prairie View Dr
- 505 Schroeder Dr
- 721 W Whittaker St
- 307 S Pruyn St
- 00 Newport Dr
- 301 S Castle St
- 2320 W Main St
- 1413 W Spruce St
- 2924 Red Stripe Rd
- 518 Roddy Rd
- 3705 Hotze Rd
- 3681 Hotze Rd
- 3717 Hotze Rd
- 3680 Hotze Rd
- 3511 Shawnee Ln
- 3523 Shawnee Ln
- 3723 Hotze Rd
- 3723 S Hotze Rd
- 3608 Andrews Ct
- 3505 Shawnee Ln
- 3735 Hotze Rd
- 3522 Shawnee Ln
- 3622 Andrews Ct
- 3504 Shawnee Ln
- 3516 Shawnee Ln
- 3635 Andrews Ct
- 3747 Hotze Rd
- 3636 Andrews Ct
- 3639 Hotze Rd
- 3649 Andrews Ct