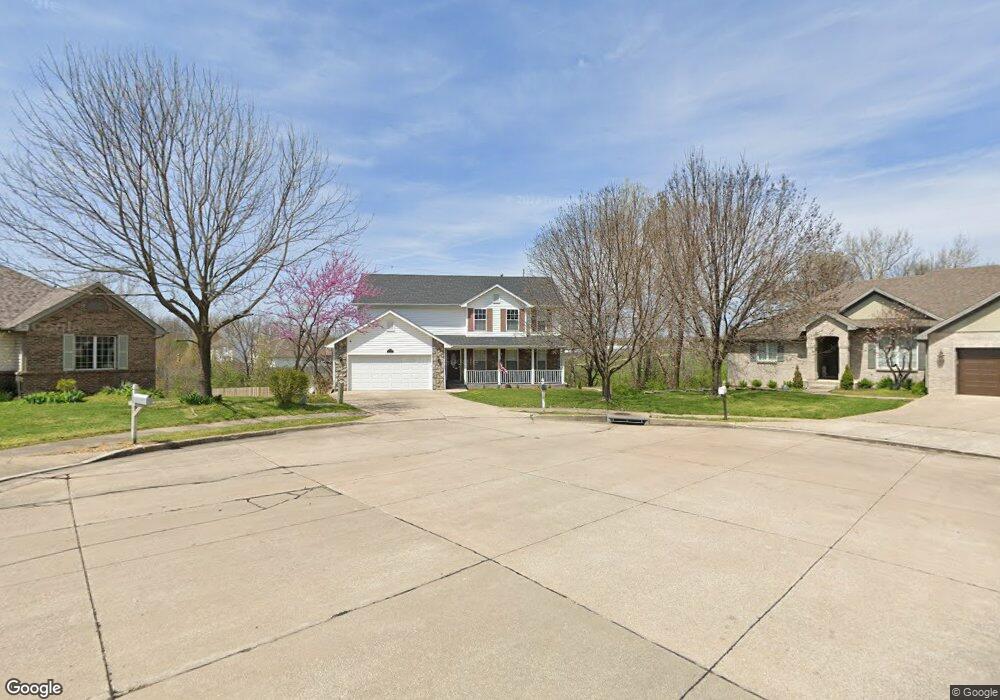
3705 Jaguar Ct Columbia, MO 65202
Estimated Value: $323,000 - $381,000
5
Beds
4
Baths
3,107
Sq Ft
$116/Sq Ft
Est. Value
About This Home
This home is located at 3705 Jaguar Ct, Columbia, MO 65202 and is currently estimated at $360,563, approximately $116 per square foot. 3705 Jaguar Ct is a home located in Boone County with nearby schools including Parkade Elementary School, West Middle School, and David H. Hickman High School.
Ownership History
Date
Name
Owned For
Owner Type
Purchase Details
Closed on
Aug 10, 2018
Sold by
Borchers Kevin W and Borchers Cathy A
Bought by
Nerman Ariel and Arnold Laura
Current Estimated Value
Home Financials for this Owner
Home Financials are based on the most recent Mortgage that was taken out on this home.
Original Mortgage
$217,075
Outstanding Balance
$188,521
Interest Rate
4.5%
Mortgage Type
New Conventional
Estimated Equity
$172,042
Purchase Details
Closed on
Oct 26, 2006
Sold by
Deutsche Bank Trust Co Americas
Bought by
Borchers Kevin W and Borchers Cathy A
Home Financials for this Owner
Home Financials are based on the most recent Mortgage that was taken out on this home.
Original Mortgage
$128,000
Interest Rate
6.41%
Mortgage Type
New Conventional
Purchase Details
Closed on
May 9, 2006
Sold by
Robinson Hunt Angela L and Robinson Hunt Gerald
Bought by
Deutsche Bank Trust Company Americas and Saxon Mortgage Services Inc
Create a Home Valuation Report for This Property
The Home Valuation Report is an in-depth analysis detailing your home's value as well as a comparison with similar homes in the area
Home Values in the Area
Average Home Value in this Area
Purchase History
| Date | Buyer | Sale Price | Title Company |
|---|---|---|---|
| Nerman Ariel | -- | Boone Central Title Co | |
| Borchers Kevin W | -- | None Available | |
| Deutsche Bank Trust Company Americas | $161,500 | None Available |
Source: Public Records
Mortgage History
| Date | Status | Borrower | Loan Amount |
|---|---|---|---|
| Open | Nerman Ariel | $217,075 | |
| Previous Owner | Borchers Kevin W | $128,000 |
Source: Public Records
Tax History Compared to Growth
Tax History
| Year | Tax Paid | Tax Assessment Tax Assessment Total Assessment is a certain percentage of the fair market value that is determined by local assessors to be the total taxable value of land and additions on the property. | Land | Improvement |
|---|---|---|---|---|
| 2025 | $2,642 | $44,840 | $4,370 | $40,470 |
| 2024 | $2,642 | $39,159 | $4,370 | $34,789 |
| 2023 | $2,620 | $39,159 | $4,370 | $34,789 |
| 2022 | $2,423 | $36,252 | $4,370 | $31,882 |
| 2021 | $2,427 | $36,252 | $4,370 | $31,882 |
| 2020 | $2,484 | $34,857 | $4,370 | $30,487 |
| 2019 | $2,484 | $34,857 | $4,370 | $30,487 |
| 2018 | $2,405 | $0 | $0 | $0 |
| 2017 | $2,372 | $33,516 | $4,370 | $29,146 |
| 2016 | $2,372 | $33,516 | $4,370 | $29,146 |
| 2015 | $2,178 | $33,516 | $4,370 | $29,146 |
| 2014 | $2,185 | $33,516 | $4,370 | $29,146 |
Source: Public Records
Map
Nearby Homes
- 5 Amazon Dr
- 3905 Jungle Tree Dr
- 3810 Crocodile Dr
- 4107 Treetop Ln
- 4008 Iguana Dr
- 0 Rangeline St
- 3405 Alligator Ln
- LOT 152 Sullivan St
- 4203 Gladden Ln
- 203 Wallaby Way
- 4008 Zambezi Dr
- LOT 151 Sullivan St
- 3601 Snow Leopard Dr
- 3800 Saddlebrook Place Unit 503
- 3800 Saddlebrook Place Unit 408
- LOT 116 Corcoran Dr
- LOT 149 Sullivan St
- LOT 134 Celebrant Ct
- LOT 122 Celebrant Ct
- LOT 148 Sullivan St
- 3703 Jaguar Ct
- 3707 Jaguar Ct
- 401 Cheetah Dr
- 3704 Jaguar Ct
- 3702 Jaguar Ct
- 400 Camel Ct
- 3700 Jaguar Ct
- 3701 Armadillo Dr
- 404 Camel Ct
- 401 Camel Ct
- 407 Cheetah Dr
- 400 Cheetah Dr
- 402 Cheetah Dr
- 3703 Armadillo Dr
- 3514 Stingray Ct
- 3700 Armadillo Dr
- 3703 Zebra Dr
- 3513 Stingray Ct
- 404 Cheetah Dr
- 3514 Sting Ray Ct