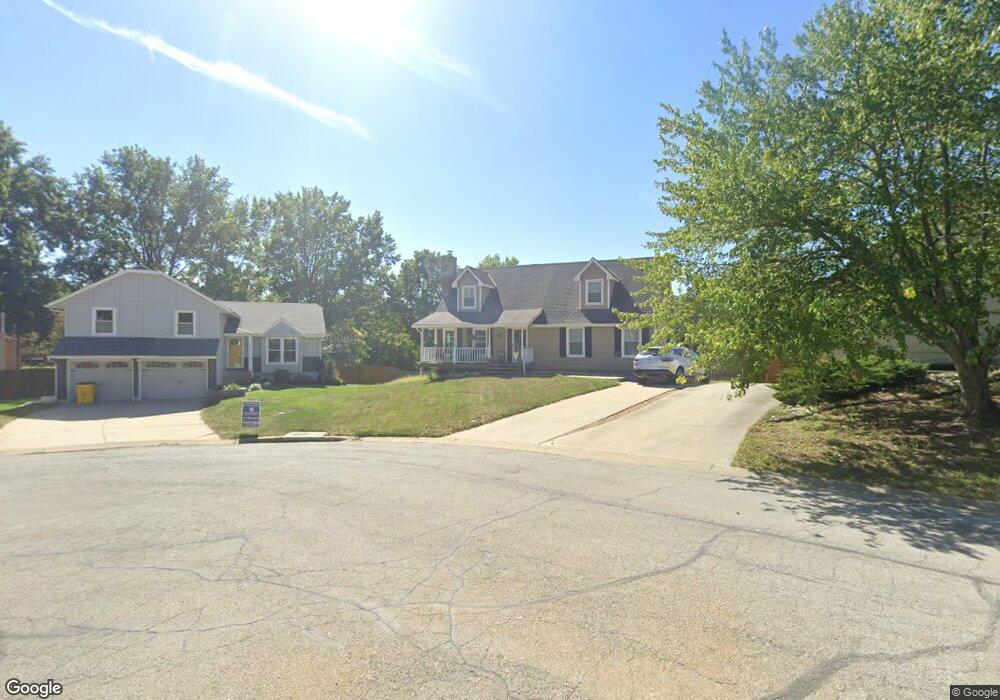
3705 SW 10th Terrace Blue Springs, MO 64015
Estimated Value: $307,000 - $360,000
3
Beds
4
Baths
1,843
Sq Ft
$182/Sq Ft
Est. Value
About This Home
This home is located at 3705 SW 10th Terrace, Blue Springs, MO 64015 and is currently estimated at $335,498, approximately $182 per square foot. 3705 SW 10th Terrace is a home located in Jackson County with nearby schools including Cordill-Mason Elementary School, Moreland Ridge Middle School, and Blue Springs South High School.
Ownership History
Date
Name
Owned For
Owner Type
Purchase Details
Closed on
Oct 31, 2019
Sold by
Patrick Mark W
Bought by
Liles Devin T and Liles Allison L
Current Estimated Value
Purchase Details
Closed on
Sep 15, 2010
Sold by
Wakeman Tracy R and Wakeman Roger D
Bought by
Patrick Mark W and Patrick Gary M
Home Financials for this Owner
Home Financials are based on the most recent Mortgage that was taken out on this home.
Original Mortgage
$137,153
Interest Rate
4.37%
Mortgage Type
FHA
Purchase Details
Closed on
Sep 22, 1998
Sold by
Raker Sandra K and Raker Sandra K
Bought by
Wakeman Roger D and Wakeman Tracy R
Home Financials for this Owner
Home Financials are based on the most recent Mortgage that was taken out on this home.
Original Mortgage
$117,700
Interest Rate
6.91%
Mortgage Type
Purchase Money Mortgage
Create a Home Valuation Report for This Property
The Home Valuation Report is an in-depth analysis detailing your home's value as well as a comparison with similar homes in the area
Home Values in the Area
Average Home Value in this Area
Purchase History
| Date | Buyer | Sale Price | Title Company |
|---|---|---|---|
| Liles Devin T | -- | Stewart Title Company | |
| Patrick Mark W | -- | Chicago | |
| Wakeman Roger D | -- | Stewart Title |
Source: Public Records
Mortgage History
| Date | Status | Borrower | Loan Amount |
|---|---|---|---|
| Previous Owner | Patrick Mark W | $137,153 | |
| Previous Owner | Wakeman Roger D | $117,700 |
Source: Public Records
Tax History Compared to Growth
Tax History
| Year | Tax Paid | Tax Assessment Tax Assessment Total Assessment is a certain percentage of the fair market value that is determined by local assessors to be the total taxable value of land and additions on the property. | Land | Improvement |
|---|---|---|---|---|
| 2025 | $4,495 | $52,516 | $8,763 | $43,753 |
| 2024 | $4,319 | $55,100 | $6,650 | $48,450 |
| 2023 | $4,319 | $53,977 | $6,177 | $47,800 |
| 2022 | $3,595 | $39,710 | $5,767 | $33,943 |
| 2021 | $3,592 | $39,710 | $5,767 | $33,943 |
| 2020 | $3,079 | $34,623 | $5,767 | $28,856 |
| 2019 | $2,674 | $34,623 | $5,767 | $28,856 |
| 2018 | $2,612 | $29,242 | $3,330 | $25,912 |
| 2017 | $2,282 | $29,242 | $3,330 | $25,912 |
| 2016 | $2,282 | $25,612 | $1,957 | $23,655 |
| 2014 | $2,022 | $22,620 | $2,176 | $20,444 |
Source: Public Records
Map
Nearby Homes
- 3608 SW 10th Street Ct
- 3908 SW 9th St
- 4000 SW 9th St
- 3605 SW Meyer Blvd
- 3205 SW 8th St
- 4405 SW 8th Street Terrace
- 1205 SW Southgate Dr
- 4712 SW 6th Terrace
- 3400 SW 22nd St
- 2807 SW Summer Creek Ct
- 2257 SW Wall St
- 4716 SW 6th Terrace
- 2253 SW Wall St
- 309 SW Moreland School Rd
- 305 SW Nelson Dr
- 500 SW Chelmsford Dr
- 3101 S 1 St
- 505 SW Newport Dr
- 509 SW Newport Dr
- 2603 SW Shadow Creek Ct
- 3705 SW 10th Street Terrace
- 3701 SW 10th Street Terrace
- 3708 SW 10th Street Terrace
- 3704 SW 11th St
- 3621 SW 10th Terrace
- 3708 SW 11th St
- 3621 SW 10th Street Terrace
- 3704 SW 10th Street Terrace
- 3700 SW 11th St
- 3700 SW 10th Street Terrace
- 3616 SW 11th St
- 3801 SW 10th Street Terrace
- 1105 SW Liggett Ct
- 3617 SW 10th Street Terrace
- 3612 SW 11th St
- 1009 SW Stonehenge St
- 913 SW Liggett Rd
- 912 SW Stonehenge St
- 3608 SW 11th St
- 1109 SW Liggett Ct