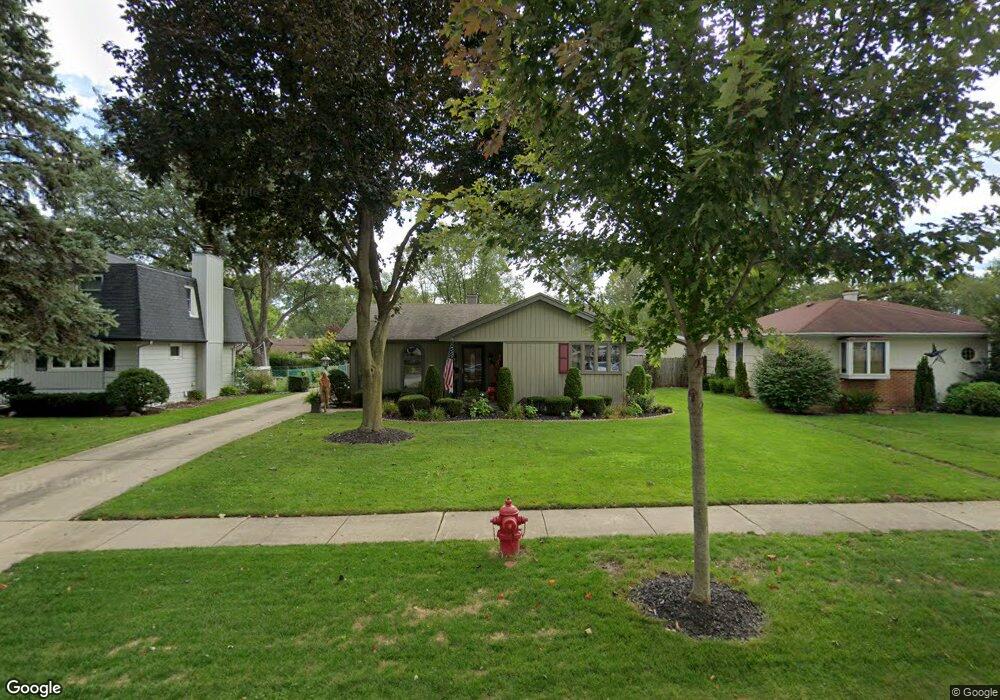
3705 Wren Ln Rolling Meadows, IL 60008
Estimated Value: $356,000 - $399,000
4
Beds
2
Baths
1,415
Sq Ft
$263/Sq Ft
Est. Value
About This Home
This home is located at 3705 Wren Ln, Rolling Meadows, IL 60008 and is currently estimated at $371,876, approximately $262 per square foot. 3705 Wren Ln is a home located in Cook County with nearby schools including Kimball Hill Elementary School, Carl Sandburg Junior High School, and Rolling Meadows High School.
Create a Home Valuation Report for This Property
The Home Valuation Report is an in-depth analysis detailing your home's value as well as a comparison with similar homes in the area
Home Values in the Area
Average Home Value in this Area
Tax History
| Year | Tax Paid | Tax Assessment Tax Assessment Total Assessment is a certain percentage of the fair market value that is determined by local assessors to be the total taxable value of land and additions on the property. | Land | Improvement |
|---|---|---|---|---|
| 2025 | $3,084 | $33,000 | $5,136 | $27,864 |
| 2024 | $3,084 | $26,000 | $4,346 | $21,654 |
| 2023 | $3,047 | $26,000 | $4,346 | $21,654 |
| 2022 | $3,047 | $26,000 | $4,346 | $21,654 |
| 2021 | $3,348 | $21,096 | $2,568 | $18,528 |
| 2020 | $3,045 | $21,096 | $2,568 | $18,528 |
| 2019 | $3,028 | $23,571 | $2,568 | $21,003 |
| 2018 | $3,377 | $25,640 | $2,370 | $23,270 |
| 2017 | $3,251 | $25,640 | $2,370 | $23,270 |
| 2016 | $3,833 | $25,640 | $2,370 | $23,270 |
| 2015 | $4,289 | $18,163 | $2,173 | $15,990 |
| 2014 | $4,099 | $18,163 | $2,173 | $15,990 |
| 2013 | $4,096 | $18,163 | $2,173 | $15,990 |
Source: Public Records
Map
Nearby Homes
- 3605 Oriole Ln
- 3712 Jay Ln
- 3710 Meadow Dr
- 2201 Kingfisher Ln
- 2302 Fulle St
- 2212 Fulle St
- 2107 Kirchoff Rd
- 2709 Lily Ln
- 3209 Trillium Cir
- 3306 Trillium Cir Unit 3001
- 3200 Thrush Ln
- 2705 Park St
- 3407 Pheasant Dr
- 3100 Town Square Dr Unit 308
- 3100 Town Square Dr Unit 204
- 1107 S Old Wilke Rd Unit 103
- 3135 Town Square Dr Unit 401
- 1117 S Old Wilke Rd Unit 206
- 2830 Northampton Dr Unit A1
- 1126 S New Wilke Rd Unit 307
Your Personal Tour Guide
Ask me questions while you tour the home.