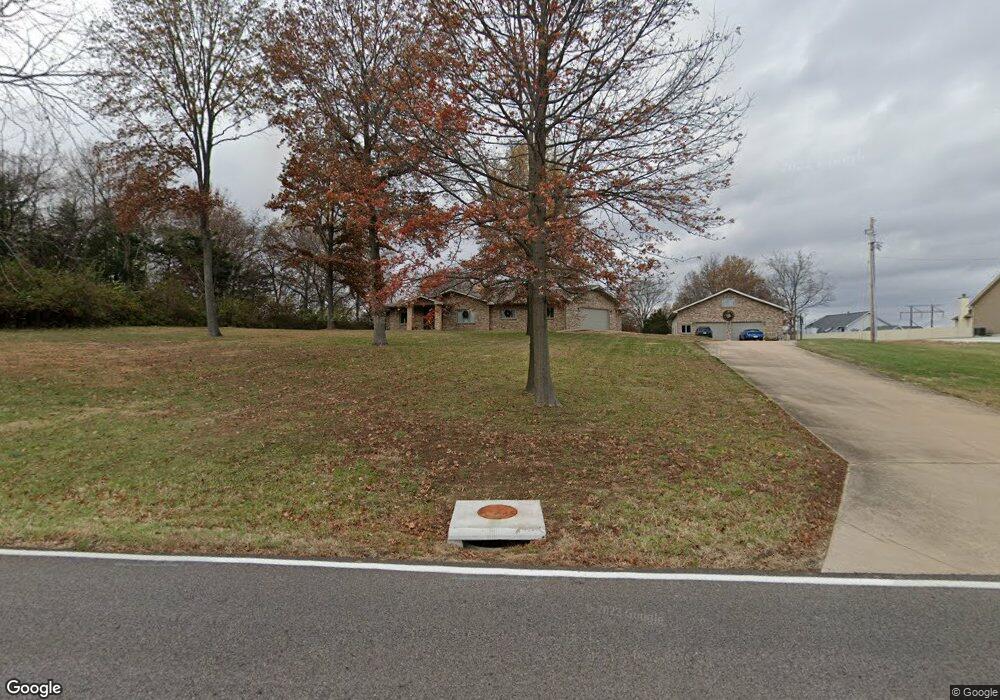
3705 Yaeger Rd Saint Louis, MO 63129
Estimated Value: $462,000 - $773,000
3
Beds
3
Baths
3,410
Sq Ft
$193/Sq Ft
Est. Value
About This Home
This home is located at 3705 Yaeger Rd, Saint Louis, MO 63129 and is currently estimated at $657,582, approximately $192 per square foot. 3705 Yaeger Rd is a home located in St. Louis County with nearby schools including Blades Elementary School, Bernard Middle School, and Oakville Senior High School.
Ownership History
Date
Name
Owned For
Owner Type
Purchase Details
Closed on
Jun 10, 2013
Sold by
Kelly Jan M and Kelly Patrick C
Bought by
Kelly Patrick C
Current Estimated Value
Home Financials for this Owner
Home Financials are based on the most recent Mortgage that was taken out on this home.
Original Mortgage
$603,750
Outstanding Balance
$428,323
Interest Rate
3.43%
Mortgage Type
New Conventional
Estimated Equity
$229,259
Purchase Details
Closed on
Nov 28, 2006
Sold by
Kelly Patrick C and Kelly Jan M
Bought by
Kelly Patrick C and Kelly Jan M
Purchase Details
Closed on
Sep 28, 2000
Sold by
Elizabeth Rocco Mary and Coleman Jerry
Bought by
Kelly Patrick C and Kelly Jan M
Home Financials for this Owner
Home Financials are based on the most recent Mortgage that was taken out on this home.
Original Mortgage
$120,500
Interest Rate
7.99%
Create a Home Valuation Report for This Property
The Home Valuation Report is an in-depth analysis detailing your home's value as well as a comparison with similar homes in the area
Home Values in the Area
Average Home Value in this Area
Purchase History
| Date | Buyer | Sale Price | Title Company |
|---|---|---|---|
| Kelly Patrick C | -- | Title Partners Agency Llc | |
| Kelly Jan M | -- | Title Partners Agency Llc | |
| Kelly Patrick C | -- | None Available | |
| Kelly Patrick C | $120,500 | -- |
Source: Public Records
Mortgage History
| Date | Status | Borrower | Loan Amount |
|---|---|---|---|
| Open | Kelly Jan M | $603,750 | |
| Previous Owner | Kelly Patrick C | $120,500 |
Source: Public Records
Tax History Compared to Growth
Tax History
| Year | Tax Paid | Tax Assessment Tax Assessment Total Assessment is a certain percentage of the fair market value that is determined by local assessors to be the total taxable value of land and additions on the property. | Land | Improvement |
|---|---|---|---|---|
| 2025 | $7,312 | $163,690 | $37,070 | $126,620 |
| 2024 | $7,312 | $109,250 | $24,720 | $84,530 |
| 2023 | $7,312 | $109,250 | $24,720 | $84,530 |
| 2022 | $7,180 | $109,250 | $19,780 | $89,470 |
| 2021 | $6,947 | $114,910 | $19,780 | $95,130 |
| 2020 | $6,543 | $97,850 | $19,080 | $78,770 |
| 2019 | $6,524 | $97,850 | $19,080 | $78,770 |
| 2018 | $6,386 | $86,490 | $15,160 | $71,330 |
| 2017 | $6,377 | $86,490 | $15,160 | $71,330 |
| 2016 | $6,043 | $78,620 | $15,160 | $63,460 |
| 2015 | $5,546 | $78,620 | $15,160 | $63,460 |
| 2014 | $4,918 | $68,970 | $11,290 | $57,680 |
Source: Public Records
Map
Nearby Homes
- 5735 Dove Meadow Ln
- 5735 White Pine Dr
- 5568 Oakville Heights Ct
- 5361 Casa Royale Dr
- 5227 Patterson Rd
- 5581 Baronridge Dr Unit 5
- 3620 Mango Dr
- 5569 Baronridge Dr Unit 4
- 5569 Baronridge Dr Unit 10
- 3652 Lemay Woods Dr
- 5543 Baronridge Dr Unit 3
- 4694 Baumgartner Rd
- 3715 Pinon Pine Ct
- 5216 Autumnwinds Dr
- 3262 Country Hollow Dr
- 3277 Country Hollow Dr
- 5896 Rockland Ln
- 5824 Bridleford Ln
- 5908 Oakville Woods Place
- 2832 Blackforest Dr Unit D
- 3720 Summerlyn Ct
- 3659 Yaeger Rd
- 3716 Summerlyn Ct
- 3721 Summerlyn Ct
- 3715 Yaeger Rd
- 3715 Summerlyn Ct
- 3654 Yaeger Rd
- 3589 Summerlyn Dr
- 3561 Summerlyn Dr
- 3707 Summerlyn Ct
- 3719 Yaeger Rd
- 3710TBB Yaeger
- 3706 Yaeger Rd
- 3710 Yaeger Rd
- 3598 Summerlyn Dr
- 3702 Yaeger Rd
- 3557 Summerlyn Dr
- 3594 Summerlyn Dr
- 3581 Summerlyn Dr
- 3569 Summerlyn Dr