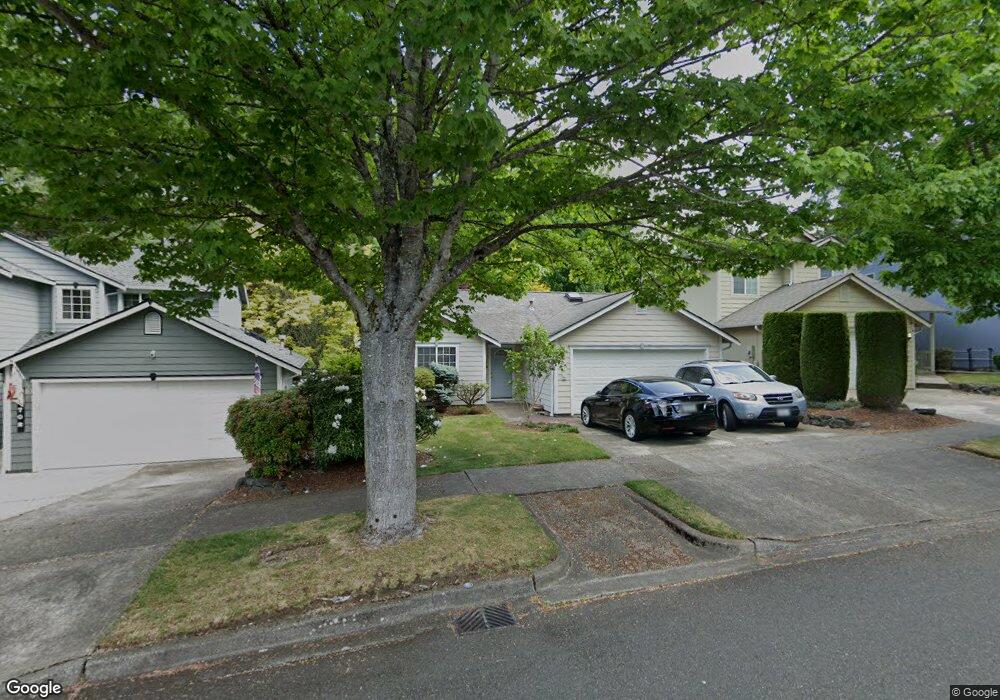
3706 30th Ave SE Olympia, WA 98501
Estimated Value: $423,000 - $442,000
3
Beds
2
Baths
1,068
Sq Ft
$407/Sq Ft
Est. Value
About This Home
This home is located at 3706 30th Ave SE, Olympia, WA 98501 and is currently estimated at $434,785, approximately $407 per square foot. 3706 30th Ave SE is a home located in Thurston County with nearby schools including McKenny Elementary School, Washington Middle School, and Olympia High School.
Ownership History
Date
Name
Owned For
Owner Type
Purchase Details
Closed on
Oct 10, 2006
Sold by
Morris Daryl T and Wickman Cheryl L
Bought by
Kindelon Richard P and Kindelon Carolynn K
Current Estimated Value
Purchase Details
Closed on
May 12, 2006
Sold by
Morris Daryl T and Wickman Cheryl L
Bought by
Morris Daryl T and Wickman Cheryl L
Purchase Details
Closed on
Aug 4, 2003
Sold by
Morris Betty I
Bought by
Morris Betty I and Betty I Morris Revocable Living Trust
Purchase Details
Closed on
Oct 17, 2002
Sold by
Mayer Robert D
Bought by
Morris Betty I
Purchase Details
Closed on
May 19, 1999
Sold by
Keystone Homes Inc
Bought by
Mayer Robert D
Home Financials for this Owner
Home Financials are based on the most recent Mortgage that was taken out on this home.
Original Mortgage
$74,900
Interest Rate
6.92%
Create a Home Valuation Report for This Property
The Home Valuation Report is an in-depth analysis detailing your home's value as well as a comparison with similar homes in the area
Home Values in the Area
Average Home Value in this Area
Purchase History
| Date | Buyer | Sale Price | Title Company |
|---|---|---|---|
| Kindelon Richard P | $232,280 | Chicago Title Company | |
| Morris Daryl T | -- | None Available | |
| Morris Betty I | -- | -- | |
| Morris Betty I | $153,939 | Transnation Title Insurance | |
| Mayer Robert D | $134,900 | Chicago Title Insurance Co |
Source: Public Records
Mortgage History
| Date | Status | Borrower | Loan Amount |
|---|---|---|---|
| Previous Owner | Mayer Robert D | $74,900 |
Source: Public Records
Tax History Compared to Growth
Tax History
| Year | Tax Paid | Tax Assessment Tax Assessment Total Assessment is a certain percentage of the fair market value that is determined by local assessors to be the total taxable value of land and additions on the property. | Land | Improvement |
|---|---|---|---|---|
| 2024 | $476 | $347,800 | $127,100 | $220,700 |
| 2023 | $476 | $330,400 | $100,100 | $230,300 |
| 2022 | $3,045 | $315,900 | $80,200 | $235,700 |
| 2021 | $2,856 | $254,500 | $65,400 | $189,100 |
| 2020 | $2,816 | $220,900 | $76,600 | $144,300 |
| 2019 | $2,500 | $212,500 | $69,900 | $142,600 |
| 2018 | $2,398 | $177,900 | $51,200 | $126,700 |
| 2017 | $2,188 | $174,750 | $50,950 | $123,800 |
| 2016 | $1,945 | $162,850 | $44,950 | $117,900 |
| 2014 | -- | $155,250 | $45,750 | $109,500 |
Source: Public Records
Map
Nearby Homes
- 3005 Powder Ridge St SE
- 3904 Hoffman Ct SE
- 3401 Bittersweet St SE
- 2537 Kempton St SE
- 4040 27th Ave SE
- 1913 Greenfield St SE
- 3014 21st Ave SE
- 3630 Wiggins Rd SE
- 2413 Westlake Dr SE
- 2807 Kirkaldy Ct SE
- 3525 Humphrey St SE
- 2410 Westlake Dr SE
- 2534 Wedgewood Ct SE
- 1910 van Epps St SE
- 3526 17th Way SE Unit 8
- 3502 40th Ave SE
- 1617 Fones Rd SE Unit 13
- 4019 Wexford Loop SE
- 1420 Magnolia St SE
- 2802 Burnaby Park Loop SE
- 3710 30th Ave SE
- 3702 30th Ave SE
- 3714 30th Ave SE
- 2905 Solitude St SE
- 3638 30th Ave SE
- 2901 Solitude St SE
- 3707 30th Ave SE
- 3634 30th Ave SE
- 3701 Autumnwood Ct SE
- 3001 Powder Ridge St SE
- 3703 Autumnwood Ct SE
- 3008 Powder Ridge St SE
- 3720 30th Ave SE
- 3711 30th Ave SE
- 3628 30th Ave SE
- 3715 30th Ave SE
- 3010 Powder Ridge St SE
- 2908 Solitude St SE
- 3615 Autumnwood Ct SE
- 2902 Solitude St SE