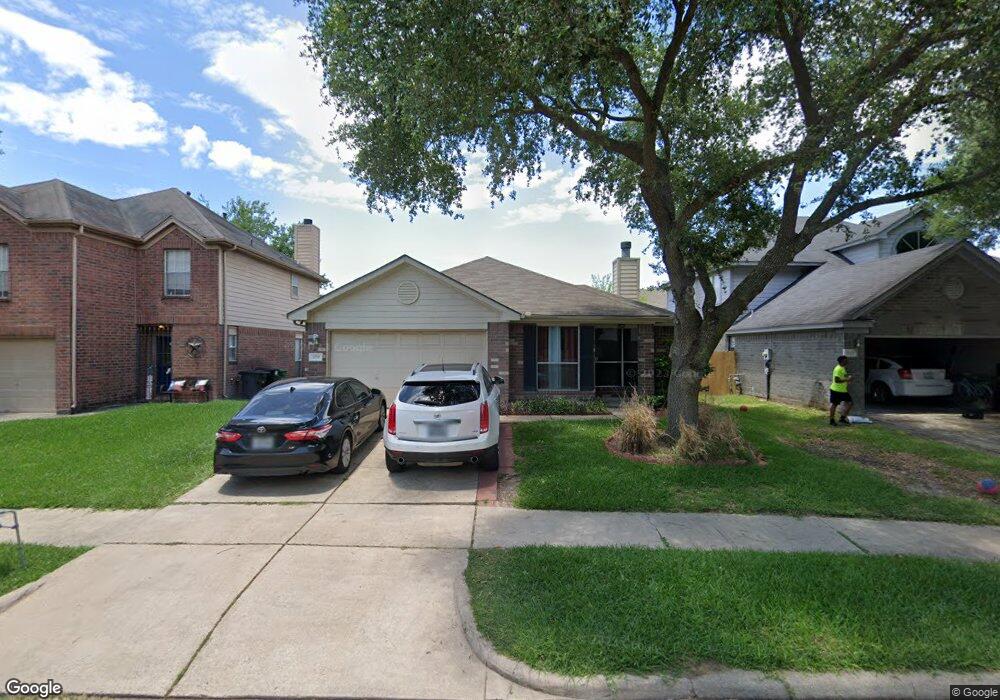
3706 Red Fir Dr Houston, TX 77088
Greater Inwood NeighborhoodEstimated Value: $186,000 - $205,000
3
Beds
2
Baths
1,228
Sq Ft
$160/Sq Ft
Est. Value
About This Home
This home is located at 3706 Red Fir Dr, Houston, TX 77088 and is currently estimated at $196,407, approximately $159 per square foot. 3706 Red Fir Dr is a home located in Harris County with nearby schools including Stovall School, Caraway Intermediate School, and Caraway Elementary School.
Ownership History
Date
Name
Owned For
Owner Type
Purchase Details
Closed on
Apr 13, 2017
Sold by
Williams Stephanie
Bought by
Vaughn Britney
Current Estimated Value
Home Financials for this Owner
Home Financials are based on the most recent Mortgage that was taken out on this home.
Original Mortgage
$112,917
Outstanding Balance
$96,208
Interest Rate
5.12%
Mortgage Type
FHA
Estimated Equity
$100,199
Purchase Details
Closed on
Oct 25, 2000
Sold by
Gage Iva J
Bought by
Williams Stephanie
Home Financials for this Owner
Home Financials are based on the most recent Mortgage that was taken out on this home.
Original Mortgage
$74,386
Interest Rate
7.89%
Mortgage Type
FHA
Purchase Details
Closed on
Apr 21, 1997
Sold by
Gateway Homes Inc
Bought by
Gage Iva J
Home Financials for this Owner
Home Financials are based on the most recent Mortgage that was taken out on this home.
Original Mortgage
$70,691
Interest Rate
7.82%
Create a Home Valuation Report for This Property
The Home Valuation Report is an in-depth analysis detailing your home's value as well as a comparison with similar homes in the area
Home Values in the Area
Average Home Value in this Area
Purchase History
| Date | Buyer | Sale Price | Title Company |
|---|---|---|---|
| Vaughn Britney | -- | Texas American Title Co | |
| Williams Stephanie | -- | Houston Title Co | |
| Gage Iva J | -- | Stewart Title |
Source: Public Records
Mortgage History
| Date | Status | Borrower | Loan Amount |
|---|---|---|---|
| Open | Vaughn Britney | $112,917 | |
| Previous Owner | Williams Stephanie | $74,386 | |
| Previous Owner | Gage Iva J | $70,691 | |
| Closed | Williams Stephanie | $3,500 |
Source: Public Records
Tax History Compared to Growth
Tax History
| Year | Tax Paid | Tax Assessment Tax Assessment Total Assessment is a certain percentage of the fair market value that is determined by local assessors to be the total taxable value of land and additions on the property. | Land | Improvement |
|---|---|---|---|---|
| 2025 | $2,599 | $191,778 | $39,038 | $152,740 |
| 2024 | $2,599 | $191,778 | $39,038 | $152,740 |
| 2023 | $2,599 | $201,447 | $44,541 | $156,906 |
| 2022 | $3,539 | $171,088 | $29,694 | $141,394 |
| 2021 | $3,369 | $134,129 | $20,538 | $113,591 |
| 2020 | $3,223 | $128,409 | $20,538 | $107,871 |
| 2019 | $3,071 | $110,988 | $20,538 | $90,450 |
| 2018 | $1,161 | $105,840 | $20,538 | $85,302 |
| 2017 | $2,670 | $105,840 | $20,538 | $85,302 |
| 2016 | $2,428 | $93,834 | $20,538 | $73,296 |
| 2015 | $1,711 | $83,197 | $12,867 | $70,330 |
| 2014 | $1,711 | $79,317 | $12,867 | $66,450 |
Source: Public Records
Map
Nearby Homes
- 8803 Cold Lake Dr
- 8814 Woodcamp Dr
- 8711 Wild Basin Dr
- 8518 Wild Basin Dr
- 3718 Storm Creek Dr
- 8510 Woodcamp Dr
- 3201 Stallings Dr
- 0 Genemaury St
- 7808 Inwood Grove Ln
- 7814 Inwood Grove Ln
- 3322 Mccrarey Dr
- 0 Dollywright St Unit 49022715
- 0 Glenn Unit 90901807
- 3210 Mccrarey Dr
- 7718 Inwood Grove Ln
- 7717 Inwood Hills Ln
- 7716 Inwood Grove Ln
- 2923 Ellington St
- 7712 Inwood Grove Ln
- 7709 Inwood Hills Ln
- 3710 Red Fir Dr
- 3702 Red Fir Dr
- 3711 Villa Glen Dr
- 3707 Villa Glen Dr
- 3715 Villa Glen Dr
- 8819 High Mountain Dr
- 3718 Red Fir Dr
- 8826 Cold Lake Dr
- 3719 Villa Glen Dr
- 3642 Red Fir Dr
- 3723 Villa Glen Dr
- 8815 High Mountain Dr
- 3667 Villa Glen Dr
- 3802 Red Fir Dr
- 8822 Cold Lake Dr
- 3638 Red Fir Dr
- 8818 High Mountain Dr
- 8811 High Mountain Dr
- 3663 Villa Glen Dr
- 8818 Cold Lake Dr