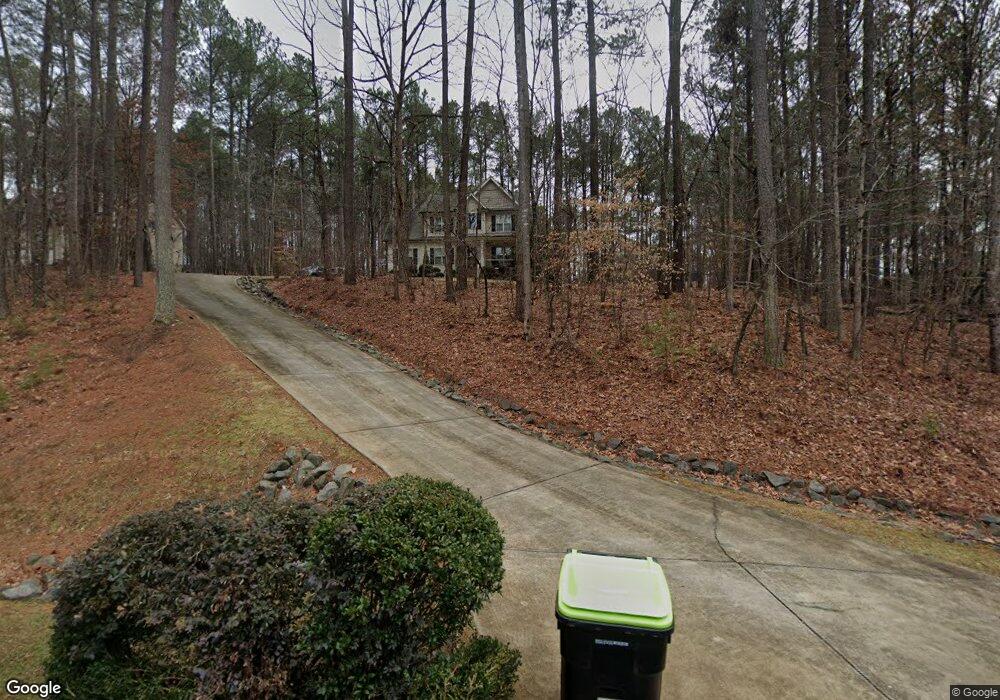
3706 Sapphire Ct Franklinton, NC 27525
Estimated Value: $393,304 - $428,000
3
Beds
3
Baths
2,093
Sq Ft
$198/Sq Ft
Est. Value
About This Home
This home is located at 3706 Sapphire Ct, Franklinton, NC 27525 and is currently estimated at $414,326, approximately $197 per square foot. 3706 Sapphire Ct is a home located in Franklin County with nearby schools including Tar River Elementary School, G.C. Hawley Middle School, and South Granville High School.
Ownership History
Date
Name
Owned For
Owner Type
Purchase Details
Closed on
Dec 16, 2019
Sold by
Hollenbeck Dennis and Hollenbeck Lorita M
Bought by
Scott Shannon Brian and Scott April
Current Estimated Value
Purchase Details
Closed on
Apr 12, 2017
Sold by
Herman David Lee and Herman Kelly Dempsey
Bought by
Hollenbeck Dennis and Hollenbeck Lorita M
Home Financials for this Owner
Home Financials are based on the most recent Mortgage that was taken out on this home.
Original Mortgage
$121,500
Interest Rate
4.1%
Mortgage Type
New Conventional
Purchase Details
Closed on
May 11, 2012
Sold by
Mallard Homes Inc
Bought by
Herman David Lee and Herman Kelly Dempsey
Home Financials for this Owner
Home Financials are based on the most recent Mortgage that was taken out on this home.
Original Mortgage
$199,710
Interest Rate
4.01%
Mortgage Type
New Conventional
Create a Home Valuation Report for This Property
The Home Valuation Report is an in-depth analysis detailing your home's value as well as a comparison with similar homes in the area
Home Values in the Area
Average Home Value in this Area
Purchase History
| Date | Buyer | Sale Price | Title Company |
|---|---|---|---|
| Scott Shannon Brian | $265,000 | None Available | |
| Hollenbeck Dennis | $235,000 | None Available | |
| Herman David Lee | $222,000 | None Available |
Source: Public Records
Mortgage History
| Date | Status | Borrower | Loan Amount |
|---|---|---|---|
| Previous Owner | Hollenbeck Dennis | $121,500 | |
| Previous Owner | Herman David Lee | $199,710 |
Source: Public Records
Tax History Compared to Growth
Tax History
| Year | Tax Paid | Tax Assessment Tax Assessment Total Assessment is a certain percentage of the fair market value that is determined by local assessors to be the total taxable value of land and additions on the property. | Land | Improvement |
|---|---|---|---|---|
| 2025 | $2,404 | $344,645 | $40,000 | $304,645 |
| 2024 | $2,404 | $344,645 | $40,000 | $304,645 |
| 2023 | $2,401 | $236,825 | $32,500 | $204,325 |
| 2022 | $2,162 | $236,825 | $32,500 | $204,325 |
| 2021 | $2,015 | $236,825 | $32,500 | $204,325 |
| 2020 | $2,025 | $236,825 | $32,500 | $204,325 |
| 2019 | $2,015 | $236,825 | $32,500 | $204,325 |
| 2018 | $2,015 | $236,825 | $32,500 | $204,325 |
| 2016 | $1,750 | $195,606 | $32,500 | $163,106 |
| 2015 | $1,651 | $195,606 | $32,500 | $163,106 |
| 2014 | $1,649 | $195,606 | $32,500 | $163,106 |
| 2013 | -- | $195,606 | $32,500 | $163,106 |
Source: Public Records
Map
Nearby Homes
- 4106 Geneva Dr
- 2069 Tart Dr Unit 13
- 2122 Olde Brassfield Ln
- 2103 Troys Trail
- 4131 Morton Ln
- 3828 Saint Lucy Dr
- 2555 Winding Creek Ln
- 2558 Buckingham Dr
- 2711 Flat Rock Rd
- 2706 Flat Rock Rd
- 2730 Flat Rock Rd
- 2482 Patton Ln
- 2508 Patton Ln
- 3855 Ironwood Dr
- 2074 W Green St
- 1710 Eddy Ct
- 110 Castlebury Ln
- 1726 Rapids Ct
- 70 Grist Mill Dr
- 00 Stonehouse Ct
- 3706 Sapphire Ct Unit 15
- 3700 Sapphire Ct
- 3700 Sapphire Ct Unit 13
- 3708 Sapphire Ct Unit L16R
- 3708 Sapphire Ct Unit 16R
- 3708 Sapphire Ct
- 3704 Sapphire Ct
- 2129 Turquoise Ln
- 2129 Turquoise Ln Unit 12
- 3707 Sapphire Ct
- 3707 Sapphire Ct Unit L29
- 3705 Sapphire Ct
- 3705 Sapphire Ct Unit L30
- 3712 Sapphire Ct
- 3712 Sapphire Ct Unit 18R
- 3709 Sapphire Ct Unit 28
- 3709 Sapphire Ct
- 2130 Turquoise Ln
- 2130 Turquoise Ln Unit 11
- 2125 Turquoise Ln Unit 13