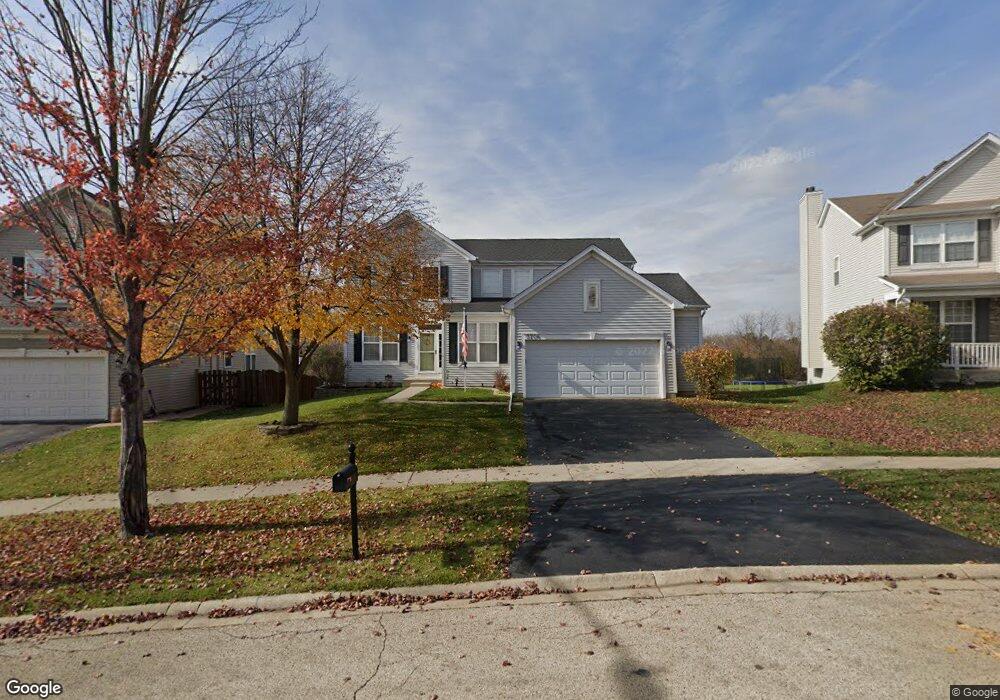
3706 Sonoma Cir Lake In the Hills, IL 60156
Estimated Value: $387,000 - $472,000
4
Beds
4
Baths
2,352
Sq Ft
$188/Sq Ft
Est. Value
About This Home
This home is located at 3706 Sonoma Cir, Lake In the Hills, IL 60156 and is currently estimated at $442,364, approximately $188 per square foot. 3706 Sonoma Cir is a home located in McHenry County with nearby schools including Martin Elementary School, Chesak Elementary School, and Marlowe Middle School.
Ownership History
Date
Name
Owned For
Owner Type
Purchase Details
Closed on
Mar 1, 2010
Sold by
Wells Fargo Bank Na
Bought by
Eisenrich Nicole M
Current Estimated Value
Home Financials for this Owner
Home Financials are based on the most recent Mortgage that was taken out on this home.
Original Mortgage
$205,000
Interest Rate
4.74%
Mortgage Type
VA
Purchase Details
Closed on
Dec 19, 2008
Sold by
Cardenas
Bought by
Wells Fargo Bank Na
Purchase Details
Closed on
Sep 18, 2003
Sold by
The Ryland Group Inc
Bought by
Navarro Oscar E and Navarro Jean A
Home Financials for this Owner
Home Financials are based on the most recent Mortgage that was taken out on this home.
Original Mortgage
$240,000
Interest Rate
6.25%
Mortgage Type
Purchase Money Mortgage
Purchase Details
Closed on
Apr 11, 2003
Sold by
Meadowbrook Lp
Bought by
The Ryland Group Inc
Create a Home Valuation Report for This Property
The Home Valuation Report is an in-depth analysis detailing your home's value as well as a comparison with similar homes in the area
Home Values in the Area
Average Home Value in this Area
Purchase History
| Date | Buyer | Sale Price | Title Company |
|---|---|---|---|
| Eisenrich Nicole M | $205,000 | Fnt | |
| Wells Fargo Bank Na | -- | None Available | |
| Navarro Oscar E | $267,556 | Fa | |
| The Ryland Group Inc | $648,000 | Ticor |
Source: Public Records
Mortgage History
| Date | Status | Borrower | Loan Amount |
|---|---|---|---|
| Previous Owner | Eisenrich Nicole M | $205,000 | |
| Previous Owner | Navarro Oscar E | $240,000 |
Source: Public Records
Tax History Compared to Growth
Tax History
| Year | Tax Paid | Tax Assessment Tax Assessment Total Assessment is a certain percentage of the fair market value that is determined by local assessors to be the total taxable value of land and additions on the property. | Land | Improvement |
|---|---|---|---|---|
| 2024 | -- | $119,761 | $7,919 | $111,842 |
| 2023 | $7,480 | $107,583 | $7,114 | $100,469 |
| 2022 | $7,480 | $97,963 | $6,478 | $91,485 |
| 2021 | $7,232 | $92,261 | $6,101 | $86,160 |
| 2020 | $7,125 | $89,800 | $5,938 | $83,862 |
| 2019 | $6,946 | $87,507 | $5,786 | $81,721 |
| 2018 | $6,860 | $84,965 | $6,512 | $78,453 |
| 2017 | $6,946 | $80,073 | $6,137 | $73,936 |
| 2016 | $6,991 | $76,130 | $5,835 | $70,295 |
| 2013 | -- | $76,887 | $15,751 | $61,136 |
Source: Public Records
Map
Nearby Homes
- 3743 Sonoma Cir
- 5438 Danbury Cir
- 2 Danbury Ct
- 9 Danbury Ct
- 9204 Haligus Rd
- 11916 Oakley Ct
- 5259 Greenshire Cir
- 9004 Dolby St
- 2331 Claremont Ln
- 2154 Daybreak Dr
- 9507 Inverness Ct
- 9111 Marks Ct
- 11253 Victoria Ln
- 11820 Zenk Ct
- 3040 Banbury Ln
- 9743 Rainsford Dr
- 12 Baldwin Ct
- 2571 Stanton Cir
- 9054 Clinnin Ln
- 9804 Palmer Dr
- 3716 Sonoma Cir
- 3696 Sonoma Cir
- 3726 Sonoma Cir
- 3736 Sonoma Cir Unit 22
- 3633 Sonoma Cir Unit 22
- 3623 Sonoma Cir
- 3676 Sonoma Cir
- 3643 Sonoma Cir
- 3746 Sonoma Cir
- 3653 Sonoma Cir
- 3666 Sonoma Cir
- 3613 Sonoma Cir
- 3756 Sonoma Cir
- 7 Sonoma Ct
- 3663 Sonoma Cir
- 3656 Sonoma Cir
- 3603 Sonoma Cir Unit 22
- 9 Sonoma Ct
- 5 Sonoma Ct
- 3766 Sonoma Cir