Estimated Value: $457,000 - $571,000
4
Beds
2
Baths
3,035
Sq Ft
$174/Sq Ft
Est. Value
About This Home
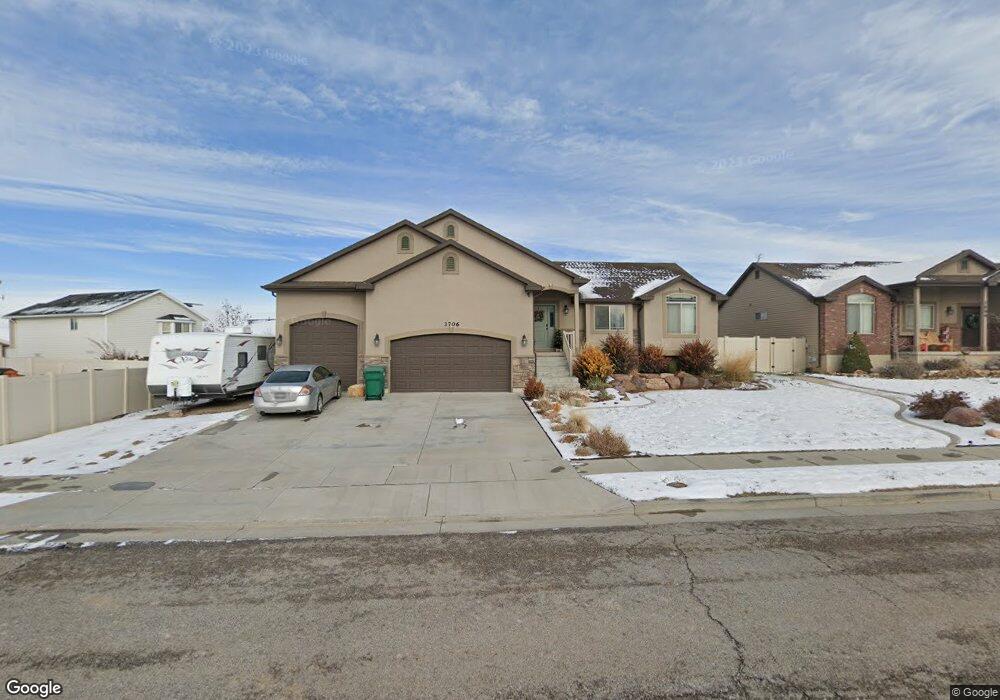
This home is located at 3706 W 5275 S, Roy, UT 84067 and is currently estimated at $528,773, approximately $174 per square foot. 3706 W 5275 S is a home located in Weber County with nearby schools including Municipal School, Roy Junior High School, and Roy High School.
Ownership History
Date
Name
Owned For
Owner Type
Purchase Details
Closed on
Jul 30, 2021
Sold by
Horstmann Anthony Jay and Horstmann Amy Leigh
Bought by
Horstmann Anthony J and Horstmann Amy L
Current Estimated Value
Purchase Details
Closed on
Aug 12, 2016
Sold by
Sampley Michael A
Bought by
Horstman Anthony Jay and Horstman Amy Leigh
Home Financials for this Owner
Home Financials are based on the most recent Mortgage that was taken out on this home.
Original Mortgage
$294,566
Outstanding Balance
$241,755
Interest Rate
4.4%
Mortgage Type
FHA
Estimated Equity
$287,018
Purchase Details
Closed on
Mar 1, 2012
Sold by
Northern Regal Homes Inc
Bought by
Sampley Michael A
Home Financials for this Owner
Home Financials are based on the most recent Mortgage that was taken out on this home.
Original Mortgage
$232,941
Interest Rate
3.75%
Mortgage Type
FHA
Create a Home Valuation Report for This Property
The Home Valuation Report is an in-depth analysis detailing your home's value as well as a comparison with similar homes in the area
Home Values in the Area
Average Home Value in this Area
Purchase History
| Date | Buyer | Sale Price | Title Company |
|---|---|---|---|
| Horstmann Anthony J | -- | Us Title Ins Agency | |
| Horstman Anthony Jay | -- | Us Title Insurance Agency | |
| Sampley Michael A | -- | Eagle Gate Title Insurance A |
Source: Public Records
Mortgage History
| Date | Status | Borrower | Loan Amount |
|---|---|---|---|
| Open | Horstman Anthony Jay | $294,566 | |
| Previous Owner | Sampley Michael A | $232,941 |
Source: Public Records
Tax History Compared to Growth
Tax History
| Year | Tax Paid | Tax Assessment Tax Assessment Total Assessment is a certain percentage of the fair market value that is determined by local assessors to be the total taxable value of land and additions on the property. | Land | Improvement |
|---|---|---|---|---|
| 2025 | $3,292 | $532,692 | $176,301 | $356,391 |
| 2024 | $3,215 | $288,199 | $96,965 | $191,234 |
| 2023 | $3,218 | $289,850 | $93,939 | $195,911 |
| 2022 | $3,109 | $286,550 | $71,924 | $214,626 |
| 2021 | $2,803 | $428,000 | $85,568 | $342,432 |
| 2020 | $2,607 | $365,000 | $85,568 | $279,432 |
| 2019 | $2,497 | $329,000 | $69,561 | $259,439 |
| 2018 | $2,362 | $293,000 | $59,582 | $233,418 |
| 2017 | $2,283 | $266,000 | $56,636 | $209,364 |
| 2016 | $2,246 | $141,080 | $30,093 | $110,987 |
| 2015 | $1,905 | $121,492 | $24,238 | $97,254 |
| 2014 | $1,833 | $115,262 | $24,238 | $91,024 |
Source: Public Records
Map
Nearby Homes
- 3766 W 5300 S
- 3607 W 5400 S
- 5235 Midland Dr
- 3820 Foxglen Dr
- 3443 W 5200 S Unit 2&3
- Poplar Plan at Highgate Cove
- Pando Plan at Highgate Cove
- 3832 W 5625 S
- 3809 W 5625 S
- 5465 S 4050 W
- 3509 W 4835 S Unit 26
- 3523 W 4835 S Unit 28
- 3524 W 4835 S Unit 22
- 4021 W 5000 S
- 5578 S 3450 W
- 4964 S 3375 W
- 4990 S 4075 W
- 5270 S 4200 W
- 4890 S 4075 W
- 3826 W 5750 S
- 3694 W 5275 S
- 3694 W 5275 S Unit 54
- 5260 S 3750 W
- 5260 S 3750 W Unit 31
- 5272 S 3750 W
- 5272 S 3750 W Unit 32
- 5248 S 3750 W
- 5248 S 3750 W Unit 30
- 3723 W 5225 S
- 3723 W 5225 S Unit 28
- 3682 W 5275 S
- 3682 W 5275 S Unit 55
- 3699 W 5275 S
- 3713 W 5275 S
- 3713 W 5275 S Unit 33
- 3741 W 5225 S
- 3741 W 5225 S Unit 29
- 3707 W 5225 S
- 5285 S 3675 W
- 3670 W 5275 S