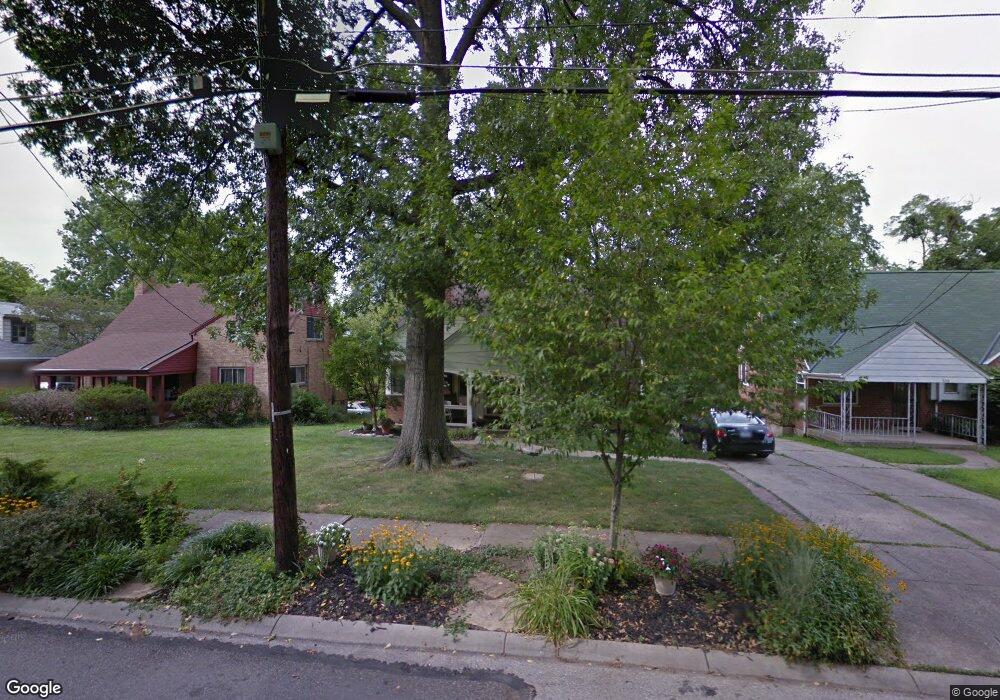
3708 Aikenside Ave Cincinnati, OH 45213
Kennedy Heights NeighborhoodEstimated Value: $223,000 - $298,000
3
Beds
1
Bath
1,110
Sq Ft
$229/Sq Ft
Est. Value
About This Home
This home is located at 3708 Aikenside Ave, Cincinnati, OH 45213 and is currently estimated at $254,109, approximately $228 per square foot. 3708 Aikenside Ave is a home located in Hamilton County with nearby schools including John P. Parker School, Shroder High School, and Clark Montessori High School.
Ownership History
Date
Name
Owned For
Owner Type
Purchase Details
Closed on
Jun 30, 2011
Sold by
Burnet Capital Llc
Bought by
H/H Group Llc
Current Estimated Value
Purchase Details
Closed on
Jul 11, 2003
Sold by
Davis Robert J
Bought by
Waldron Heather L
Home Financials for this Owner
Home Financials are based on the most recent Mortgage that was taken out on this home.
Original Mortgage
$82,400
Interest Rate
3.99%
Mortgage Type
Unknown
Purchase Details
Closed on
Jul 15, 1998
Sold by
Ewing Norby T
Bought by
Davis Robert J
Home Financials for this Owner
Home Financials are based on the most recent Mortgage that was taken out on this home.
Original Mortgage
$81,900
Interest Rate
7%
Create a Home Valuation Report for This Property
The Home Valuation Report is an in-depth analysis detailing your home's value as well as a comparison with similar homes in the area
Home Values in the Area
Average Home Value in this Area
Purchase History
| Date | Buyer | Sale Price | Title Company |
|---|---|---|---|
| H/H Group Llc | $84,500 | Attorney | |
| Burnet Capital Llc | $55,000 | American Homeland Title Agen | |
| Waldron Heather L | $103,000 | Tri Star Title Agency | |
| Davis Robert J | $91,000 | Vintage Title Agency Inc |
Source: Public Records
Mortgage History
| Date | Status | Borrower | Loan Amount |
|---|---|---|---|
| Previous Owner | Waldron Heather L | $82,400 | |
| Previous Owner | Davis Robert J | $81,900 |
Source: Public Records
Tax History Compared to Growth
Tax History
| Year | Tax Paid | Tax Assessment Tax Assessment Total Assessment is a certain percentage of the fair market value that is determined by local assessors to be the total taxable value of land and additions on the property. | Land | Improvement |
|---|---|---|---|---|
| 2024 | $3,199 | $53,403 | $14,616 | $38,787 |
| 2023 | $3,272 | $53,403 | $14,616 | $38,787 |
| 2022 | $2,639 | $38,595 | $11,008 | $27,587 |
| 2021 | $2,537 | $38,595 | $11,008 | $27,587 |
| 2020 | $2,612 | $38,595 | $11,008 | $27,587 |
| 2019 | $2,525 | $34,154 | $9,741 | $24,413 |
| 2018 | $2,529 | $34,154 | $9,741 | $24,413 |
| 2017 | $2,402 | $34,154 | $9,741 | $24,413 |
| 2016 | $2,748 | $38,542 | $9,709 | $28,833 |
| 2015 | $2,478 | $38,542 | $9,709 | $28,833 |
| 2014 | $2,496 | $38,542 | $9,709 | $28,833 |
| 2013 | $2,419 | $36,708 | $9,247 | $27,461 |
Source: Public Records
Map
Nearby Homes
- 3766 Aikenside Ave
- 57 Red Bank Rd
- 6063 Woodford Ct
- 6007 Lillian Ave
- 3635 Northdale Place
- 3813 Congreve Ave
- 6047 Kennedy Ave
- 3751 Dunloe Ave
- 6133 Red Bank Rd
- 6097 W Fordham Place
- 6124 Hedge Ave
- 6212 Coleridge Ave
- 6218 Kennedy Ave
- 6218 Coleridge Ave
- 5907 Kimberly Ave
- 5473 Ehrling Rd
- 3824 Standish Ave
- 3969 S Fordham Place
- 3962 S Fordham Place
- 6321 Tyne Ave
- 3704 Aikenside Ave
- 3712 Aikenside Ave
- 3716 Aikenside Ave
- 3700 Aikenside Ave
- 5912 Wyatt Ave
- 5867 Skyline Dr
- 5858 Wyatt Ave
- 3720 Aikenside Ave
- 5861 Skyline Dr
- 3726 Aikenside Ave
- 3656 Aikenside Ave
- 5905 Wyatt Ave
- 5857 Skyline Dr
- 3728 Aikenside Ave
- 3737 Aikenside Ave
- 3705 Woodford Rd
- 5913 Wyatt Ave
- 5850 Wyatt Ave
- 5863 Wyatt Ave
- 5856 Skyline Dr