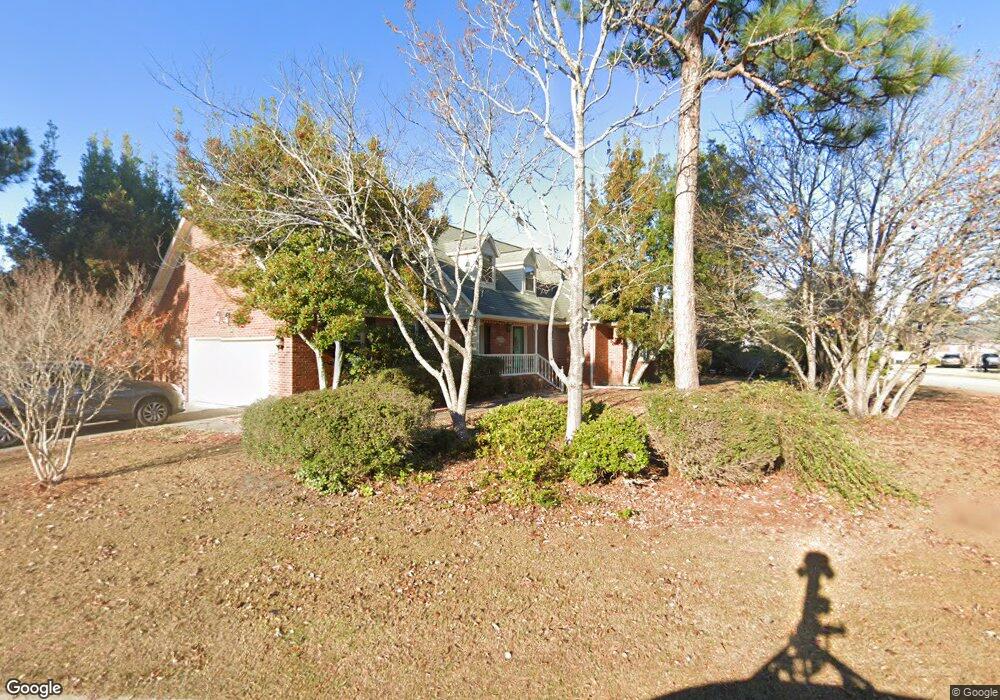
3708 Chukka Way Wilmington, NC 28409
Masonboro NeighborhoodEstimated Value: $461,000 - $523,717
3
Beds
2
Baths
2,302
Sq Ft
$213/Sq Ft
Est. Value
About This Home
This home is located at 3708 Chukka Way, Wilmington, NC 28409 and is currently estimated at $490,679, approximately $213 per square foot. 3708 Chukka Way is a home located in New Hanover County with nearby schools including Masonboro Elementary School, Roland-Grise Middle School, and John T. Hoggard High School.
Ownership History
Date
Name
Owned For
Owner Type
Purchase Details
Closed on
Apr 19, 2005
Sold by
Burnett Greg and Burnett Amber
Bought by
Mejouev Igor and Mejoueva Lioudmila
Current Estimated Value
Home Financials for this Owner
Home Financials are based on the most recent Mortgage that was taken out on this home.
Original Mortgage
$20,200
Outstanding Balance
$10,566
Interest Rate
5.99%
Mortgage Type
Credit Line Revolving
Estimated Equity
$480,113
Purchase Details
Closed on
Feb 29, 2000
Sold by
Medlin Gerald L Janice B
Bought by
Burnett Greg Amber
Purchase Details
Closed on
Jun 8, 1994
Sold by
Grifton W Jones Builder Inc
Bought by
Medlin Gerald L Janice B
Purchase Details
Closed on
May 5, 1993
Sold by
University Group Inc
Bought by
Saffo Turner Corp
Purchase Details
Closed on
May 3, 1993
Sold by
Saffo Turner Corporation
Bought by
Grifton W Jones Builder Inc
Purchase Details
Closed on
May 1, 1988
Sold by
Masonboro Properties
Bought by
Saffo Turner Corp
Create a Home Valuation Report for This Property
The Home Valuation Report is an in-depth analysis detailing your home's value as well as a comparison with similar homes in the area
Home Values in the Area
Average Home Value in this Area
Purchase History
| Date | Buyer | Sale Price | Title Company |
|---|---|---|---|
| Mejouev Igor | $202,000 | None Available | |
| Burnett Greg Amber | $151,500 | -- | |
| Medlin Gerald L Janice B | $132,000 | -- | |
| Saffo Turner Corp | -- | -- | |
| Grifton W Jones Builder Inc | $23,000 | -- | |
| Saffo Turner Corp | -- | -- |
Source: Public Records
Mortgage History
| Date | Status | Borrower | Loan Amount |
|---|---|---|---|
| Open | Mejouev Igor | $20,200 | |
| Open | Mejouev Igor | $161,600 |
Source: Public Records
Tax History Compared to Growth
Tax History
| Year | Tax Paid | Tax Assessment Tax Assessment Total Assessment is a certain percentage of the fair market value that is determined by local assessors to be the total taxable value of land and additions on the property. | Land | Improvement |
|---|---|---|---|---|
| 2025 | -- | $523,200 | $134,500 | $388,700 |
| 2023 | -- | $339,500 | $90,500 | $249,000 |
| 2022 | $2,905 | $339,500 | $90,500 | $249,000 |
| 2021 | $2,905 | $339,500 | $90,500 | $249,000 |
| 2020 | $2,449 | $232,500 | $62,200 | $170,300 |
| 2019 | $2,304 | $218,700 | $62,200 | $156,500 |
| 2018 | $2,304 | $218,700 | $62,200 | $156,500 |
| 2017 | $2,304 | $218,700 | $62,200 | $156,500 |
| 2016 | $2,225 | $200,800 | $62,200 | $138,600 |
| 2015 | $2,126 | $200,800 | $62,200 | $138,600 |
| 2014 | $2,036 | $200,800 | $62,200 | $138,600 |
Source: Public Records
Map
Nearby Homes
- 609 Mason Knoll Ct
- 110 Cabbage Inlet Ln
- 1017 Sabal Dr
- 1008 Sabal Ct
- 5419 Dunmore Rd
- 3863 Daphine Ct
- 5415 Dunmore Rd
- 4100 Purviance Ct
- 3239 Kellerton Place
- 3403 Kildare Place
- 3250 Kellerton Place
- 300 Cabbage Inlet Ln
- 439 Kelly Rd
- 5101 Avine Ct
- 5016 Treybrooke Dr
- 4204 Purviance Ct
- 517 Kelly Rd
- 800 Deer Haven Ct
- 3217 Sunset Bend Ct Unit 144
- 4045 Watersail Dr Unit 133
- 3706 Chukka Way
- 3625 Pine Bark Ct
- 5344 Beretta Way
- 3621 Pine Bark Ct
- 3629 Pine Bark Ct
- 3704 Chukka Way
- 3705 Chukka Way
- 5400 Beretta Way
- 3617 Pine Bark Ct
- 5340 Beretta Way
- 3700 Needle Sound Way
- 3538 Cordgrass Ln
- 3620 Needle Sound Way
- 5405 Beretta Way
- 5404 Beretta Way
- 5336 Beretta Way
- 3620 Pine Bark Ct
- 3613 Pine Bark Ct
- 3704 Needle Sound Way
- 3616 Pine Bark Ct