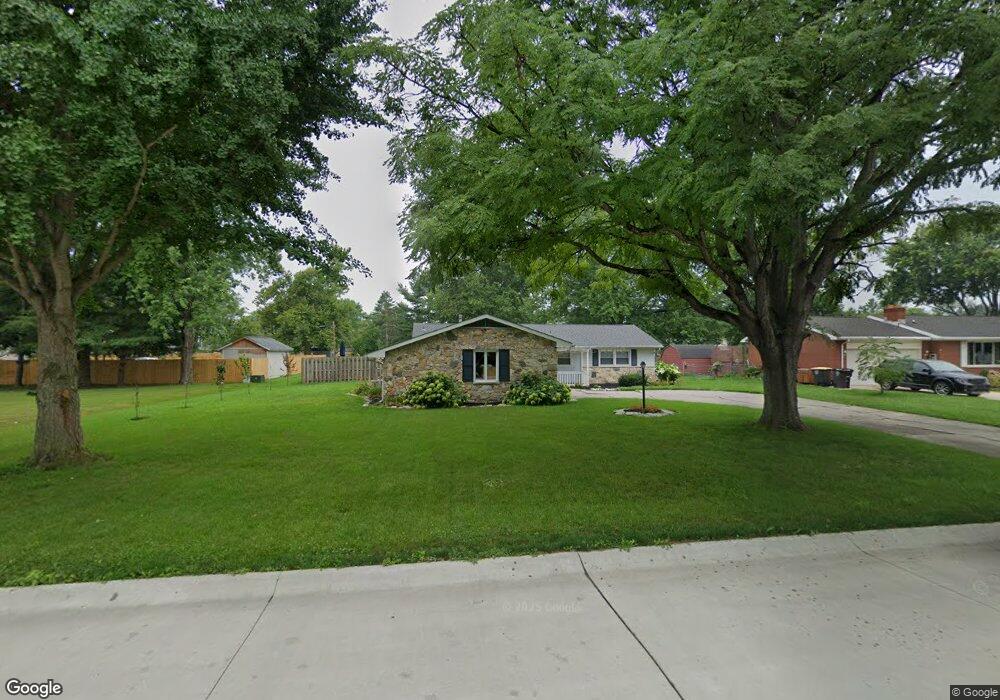
3708 E Saddle Dr Fort Wayne, IN 46804
Estimated Value: $243,000 - $255,000
3
Beds
2
Baths
1,540
Sq Ft
$162/Sq Ft
Est. Value
About This Home
This home is located at 3708 E Saddle Dr, Fort Wayne, IN 46804 and is currently estimated at $248,933, approximately $161 per square foot. 3708 E Saddle Dr is a home located in Allen County with nearby schools including Aboite Elementary School, Summit Middle School, and Homestead Senior High School.
Ownership History
Date
Name
Owned For
Owner Type
Purchase Details
Closed on
Jul 20, 2021
Sold by
Hurst William A and Hurst Kimberly M
Bought by
Clapper Zachary T and Brown Brooke N
Current Estimated Value
Home Financials for this Owner
Home Financials are based on the most recent Mortgage that was taken out on this home.
Original Mortgage
$174,600
Outstanding Balance
$157,465
Interest Rate
2.93%
Mortgage Type
New Conventional
Estimated Equity
$91,468
Purchase Details
Closed on
Dec 20, 2017
Bought by
Hurst William
Home Financials for this Owner
Home Financials are based on the most recent Mortgage that was taken out on this home.
Original Mortgage
$105,440
Interest Rate
3.93%
Purchase Details
Closed on
Jun 6, 2002
Sold by
Deiser Michael K and Deiser Joyce D
Bought by
Hurst William A and Hurst Kimberly M
Home Financials for this Owner
Home Financials are based on the most recent Mortgage that was taken out on this home.
Original Mortgage
$93,532
Interest Rate
6.87%
Mortgage Type
FHA
Create a Home Valuation Report for This Property
The Home Valuation Report is an in-depth analysis detailing your home's value as well as a comparison with similar homes in the area
Home Values in the Area
Average Home Value in this Area
Purchase History
| Date | Buyer | Sale Price | Title Company |
|---|---|---|---|
| Clapper Zachary T | $180,000 | Fidelity Nationl Ttl Co Llc | |
| Hurst William | -- | -- | |
| Hurst William A | -- | Three Rivers Title Company I |
Source: Public Records
Mortgage History
| Date | Status | Borrower | Loan Amount |
|---|---|---|---|
| Open | Clapper Zachary T | $174,600 | |
| Previous Owner | Hurst William | $105,440 | |
| Previous Owner | Hurst William | -- | |
| Previous Owner | Hurst William A | $93,532 |
Source: Public Records
Tax History
| Year | Tax Paid | Tax Assessment Tax Assessment Total Assessment is a certain percentage of the fair market value that is determined by local assessors to be the total taxable value of land and additions on the property. | Land | Improvement |
|---|---|---|---|---|
| 2025 | $2,466 | $236,500 | $50,000 | $186,500 |
| 2024 | $2,146 | $230,600 | $50,000 | $180,600 |
| 2023 | $2,146 | $201,500 | $20,500 | $181,000 |
| 2022 | $1,838 | $169,400 | $20,500 | $148,900 |
| 2021 | $1,614 | $152,900 | $20,500 | $132,400 |
| 2020 | $1,558 | $146,000 | $20,500 | $125,500 |
| 2019 | $1,601 | $149,300 | $20,500 | $128,800 |
| 2018 | $1,560 | $134,600 | $20,500 | $114,100 |
| 2017 | $1,419 | $121,000 | $20,500 | $100,500 |
| 2016 | $1,427 | $119,800 | $20,500 | $99,300 |
| 2014 | $1,602 | $123,400 | $20,500 | $102,900 |
| 2013 | $1,662 | $124,900 | $20,500 | $104,400 |
Source: Public Records
Map
Nearby Homes
- 3621 Turf Ln
- 3826 Turf Ln
- 4002 Winterfield Run
- 10018 Quachita Ct
- 9021 Dunmore Ln
- 9417 Crystal Spring Dr
- 8830 Voyager Dr
- 9321 Thunder Hill Place
- 4518 Bridgetown Run
- 4630 Weatherside Run
- 2707 Grenadier Ct
- 2428 Barcroft Ct
- 2818 Little Turtle Trail
- 2327 Barcroft Ct
- 9324 Saratoga Rd
- 4918 Live Oak Ct
- 10832 Deep Creek Ct
- 5194 Coventry Ln
- 2801 Wind Pump Rd
- 2820 Wind Pump Rd
- 3626 E Saddle Dr
- 3722 E Saddle Dr
- 9442 Carriage Ln
- 3629 Paddock Ct
- 3616 E Saddle Dr
- 9506 Carriage Ln
- 3707 E Saddle Dr
- 3621 Paddock Ct
- 3635 Paddock Ct
- 3625 E Saddle Dr
- 3717 E Saddle Dr
- 9526 Carriage Ln
- 3606 E Saddle Dr
- 3615 E Saddle Dr
- 3727 E Saddle Dr
- 3613 Paddock Ct
- 9528 Carriage Ln
- 3603 Paddock Ct
- 3530 E Saddle Dr
- 9441 Carriage Ln
Your Personal Tour Guide
Ask me questions while you tour the home.