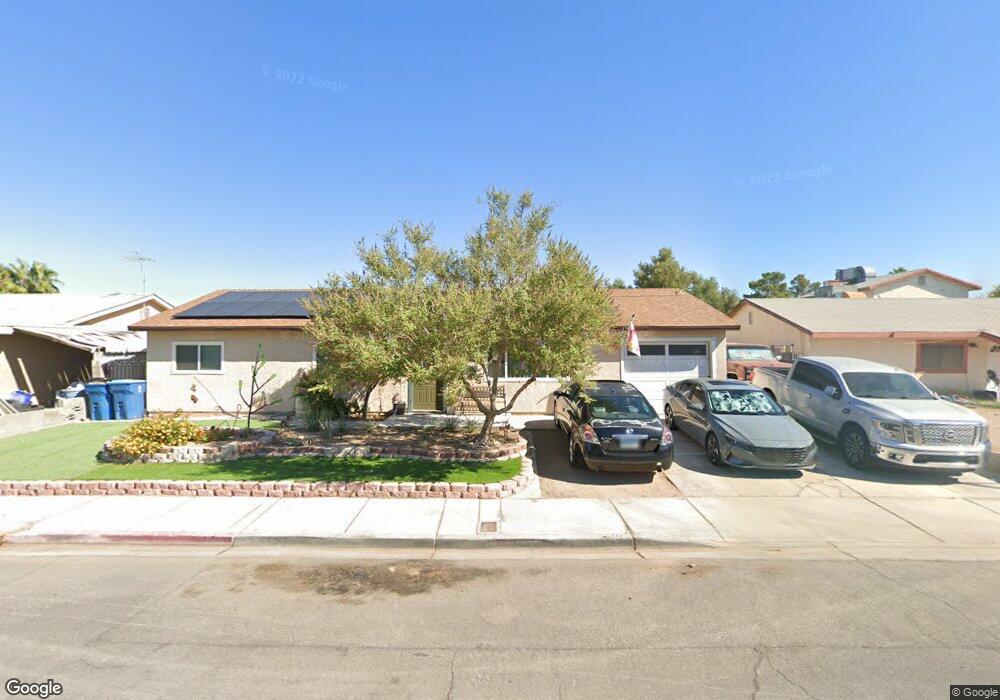
3708 Lighthouse Ave Las Vegas, NV 89110
East Las Vegas NeighborhoodEstimated Value: $340,000 - $376,000
3
Beds
2
Baths
1,612
Sq Ft
$225/Sq Ft
Est. Value
About This Home
This home is located at 3708 Lighthouse Ave, Las Vegas, NV 89110 and is currently estimated at $362,316, approximately $224 per square foot. 3708 Lighthouse Ave is a home located in Clark County with nearby schools including Oran K Gragson Elementary School, Roy West Martin Middle School, and Desert Pines High School.
Ownership History
Date
Name
Owned For
Owner Type
Purchase Details
Closed on
Jul 13, 2018
Sold by
Petropoulos Steven M
Bought by
Zemp Brent Redford and Zemp Leslie Ann
Current Estimated Value
Home Financials for this Owner
Home Financials are based on the most recent Mortgage that was taken out on this home.
Original Mortgage
$189,000
Outstanding Balance
$163,797
Interest Rate
4.5%
Mortgage Type
New Conventional
Estimated Equity
$198,519
Purchase Details
Closed on
Aug 29, 2002
Sold by
Petropoulos Terry
Bought by
Petropoulos Steven M and Petropoulos Stacy E
Home Financials for this Owner
Home Financials are based on the most recent Mortgage that was taken out on this home.
Original Mortgage
$111,650
Interest Rate
6.43%
Mortgage Type
FHA
Purchase Details
Closed on
Sep 30, 1996
Sold by
Janey Ralph S
Bought by
Petropoulos Terry
Home Financials for this Owner
Home Financials are based on the most recent Mortgage that was taken out on this home.
Original Mortgage
$78,450
Interest Rate
8%
Create a Home Valuation Report for This Property
The Home Valuation Report is an in-depth analysis detailing your home's value as well as a comparison with similar homes in the area
Home Values in the Area
Average Home Value in this Area
Purchase History
| Date | Buyer | Sale Price | Title Company |
|---|---|---|---|
| Zemp Brent Redford | $210,000 | Lawyers Title Henderson | |
| Petropoulos Steven M | -- | Lawyers Title Henderson | |
| Petropoulos Steven M | $135,000 | Pioneer National Title | |
| Petropoulos Terry | $87,000 | Land Title |
Source: Public Records
Mortgage History
| Date | Status | Borrower | Loan Amount |
|---|---|---|---|
| Open | Zemp Brent Redford | $189,000 | |
| Previous Owner | Petropoulos Steven M | $111,650 | |
| Previous Owner | Petropoulos Terry | $78,450 |
Source: Public Records
Tax History Compared to Growth
Tax History
| Year | Tax Paid | Tax Assessment Tax Assessment Total Assessment is a certain percentage of the fair market value that is determined by local assessors to be the total taxable value of land and additions on the property. | Land | Improvement |
|---|---|---|---|---|
| 2025 | $1,014 | $55,407 | $25,550 | $29,857 |
| 2024 | $985 | $55,407 | $25,550 | $29,857 |
| 2023 | $985 | $58,370 | $28,700 | $29,670 |
| 2022 | $956 | $52,296 | $24,500 | $27,796 |
| 2021 | $928 | $49,028 | $22,050 | $26,978 |
| 2020 | $898 | $48,361 | $21,000 | $27,361 |
| 2019 | $872 | $44,237 | $16,800 | $27,437 |
| 2018 | $847 | $41,863 | $15,050 | $26,813 |
| 2017 | $1,364 | $41,620 | $14,000 | $27,620 |
| 2016 | $794 | $35,532 | $7,000 | $28,532 |
| 2015 | $791 | $31,351 | $5,600 | $25,751 |
| 2014 | $768 | $23,254 | $4,200 | $19,054 |
Source: Public Records
Map
Nearby Homes
- 432 Anchor St
- 3700 Stewart Ave Unit 183
- 3908 Montebello Ave
- 4028 Lighthouse Ave
- 348 Century Dr
- 3901 Stewart Ave Unit 40
- 4100 Montebello Ave
- 3982 Saguaro Ln
- 1405 N Sandhill Rd Unit 2
- 4108 Montebello Ave
- 4117 Lighthouse Ave
- 653 Lineshack Ln
- 3933 Harris Ave
- 3620 Park Oliver Dr
- 4036 E Ogden Ave
- 833 Hedge Way Unit 2
- 833 Hedge Way Unit 6
- 4056 E Ogden Ave
- 461 N Lamb Blvd Unit H
- 89 Vallejo Ave
- 3712 Lighthouse Ave
- 3704 Lighthouse Ave
- 3709 Hudson Bay Ave
- 3713 Hudson Bay Ave
- 3705 Hudson Bay Ave
- 3716 Lighthouse Ave
- 3700 Lighthouse Ave
- 3709 Lighthouse Ave
- 3705 Lighthouse Ave
- 3713 Lighthouse Ave
- 3717 Hudson Bay Ave
- 3701 Hudson Bay Ave
- 3701 Lighthouse Ave
- 3717 Lighthouse Ave
- 3720 Lighthouse Ave
- 3612 Lighthouse Ave
- 3612 Lighthouse Ave
- 3612 Lighthouse Ave
- 3721 Hudson Bay Ave
- 3613 Hudson Bay Ave