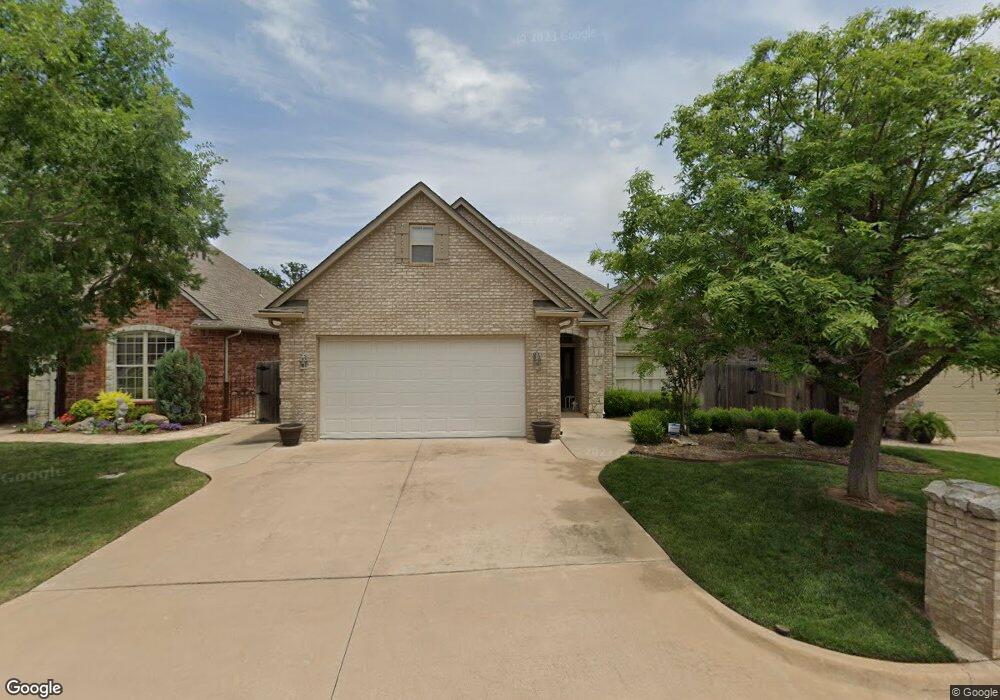
3708 Oakleaf Ct Duncan, OK 73533
Estimated Value: $249,830 - $281,000
4
Beds
2
Baths
2,049
Sq Ft
$129/Sq Ft
Est. Value
About This Home
This home is located at 3708 Oakleaf Ct, Duncan, OK 73533 and is currently estimated at $264,958, approximately $129 per square foot. 3708 Oakleaf Ct is a home located in Stephens County with nearby schools including Plato Elementary School, Duncan Middle School, and Duncan High School.
Ownership History
Date
Name
Owned For
Owner Type
Purchase Details
Closed on
May 31, 2022
Sold by
Joseph Vassella David and Joseph Diane Devona
Bought by
Petkoff Shirley Ann
Current Estimated Value
Purchase Details
Closed on
Jun 30, 2020
Sold by
Petkoff Shirley Ann
Bought by
Vasella David Joseph and Vasella Devona Diane
Purchase Details
Closed on
Feb 13, 2008
Sold by
Penny Ronald G and Penny Mary E
Bought by
Pennington Hal H and Pennington Ann M
Purchase Details
Closed on
Apr 27, 2007
Sold by
Cash Janeen Hall
Bought by
Hall Janeen
Purchase Details
Closed on
Jul 28, 2005
Sold by
Edwards James M and Edwards Mary Jayne
Bought by
Penny Ronald G and Penny Mary E
Create a Home Valuation Report for This Property
The Home Valuation Report is an in-depth analysis detailing your home's value as well as a comparison with similar homes in the area
Purchase History
| Date | Buyer | Sale Price | Title Company |
|---|---|---|---|
| Petkoff Shirley Ann | -- | None Listed On Document | |
| Vasella David Joseph | -- | Stephens County Abstract Co | |
| Petkoff Shurley Ann | $198,000 | Stephens Co Abstract Co | |
| Pennington Hal H | $204,000 | Stewart Abstract & Title | |
| Hall Janeen | -- | None Available | |
| Penny Ronald G | $160,000 | None Available |
Source: Public Records
Tax History
| Year | Tax Paid | Tax Assessment Tax Assessment Total Assessment is a certain percentage of the fair market value that is determined by local assessors to be the total taxable value of land and additions on the property. | Land | Improvement |
|---|---|---|---|---|
| 2025 | $2,213 | $26,237 | $2,101 | $24,136 |
| 2024 | $2,081 | $24,428 | $2,101 | $22,327 |
| 2023 | $2,081 | $24,356 | $2,101 | $22,255 |
| 2022 | $1,888 | $22,206 | $2,101 | $20,105 |
| 2021 | $1,887 | $22,162 | $2,101 | $20,061 |
| 2020 | $1,725 | $20,972 | $2,101 | $18,871 |
| 2019 | $1,708 | $20,739 | $2,101 | $18,638 |
| 2018 | $1,777 | $20,951 | $2,101 | $18,850 |
| 2017 | $1,780 | $21,712 | $2,101 | $19,611 |
| 2016 | $1,774 | $21,869 | $2,101 | $19,768 |
| 2015 | $1,812 | $21,869 | $2,101 | $19,768 |
| 2014 | $1,812 | $21,869 | $2,101 | $19,768 |
Source: Public Records
Map
Nearby Homes
- 3710 Oakleaf Ct
- 3606 Woodknoll
- 3602 Woodknoll
- 1209 Bent Tree St
- 1205 Timbercreek Dr
- 3505 Spencer Rd
- 1705 Foxboro Dr
- 3202 Williamsburg St
- 805 Daryl Place
- 2702 Wildwood Place
- 2001 Kingsbury Rd
- 1014 Oakview Dr
- 2518 Wildwood Place
- 0 Clear Springs Dr
- NO ADDRESS W Plato Rd
- 1108 1108 W Plato Unit 40
- 1108 W Plato Rd Unit 10
- 1108 W Plato Rd Unit 29
- 2306 Northridge Dr
- 3990 N Ridgeview Dr
- 3708 Oakleaf Ct
- 3706 Oakleaf Ct
- 3704 Oakleaf Ct
- 3707 Woodknoll
- 3712 Oakleaf Ct
- 3702 3702 Oakleaf Ct
- 3705 Woodknoll
- 3702 Oakleaf Ct
- 3709 Woodknoll
- 3703 Woodknoll
- 3707 Oakleaf Ct
- 3705 Oakleaf Ct
- 3709 Oakleaf Ct
- 3711 Woodknoll
- 3703 Oakleaf Ct
- 3701 Woodknoll
- 3711 Oakleaf Ct
- 3711 Oakleaf Ct
- 3701 Oakleaf Ct
- 1406 Oakleaf Ct
Your Personal Tour Guide
Ask me questions while you tour the home.