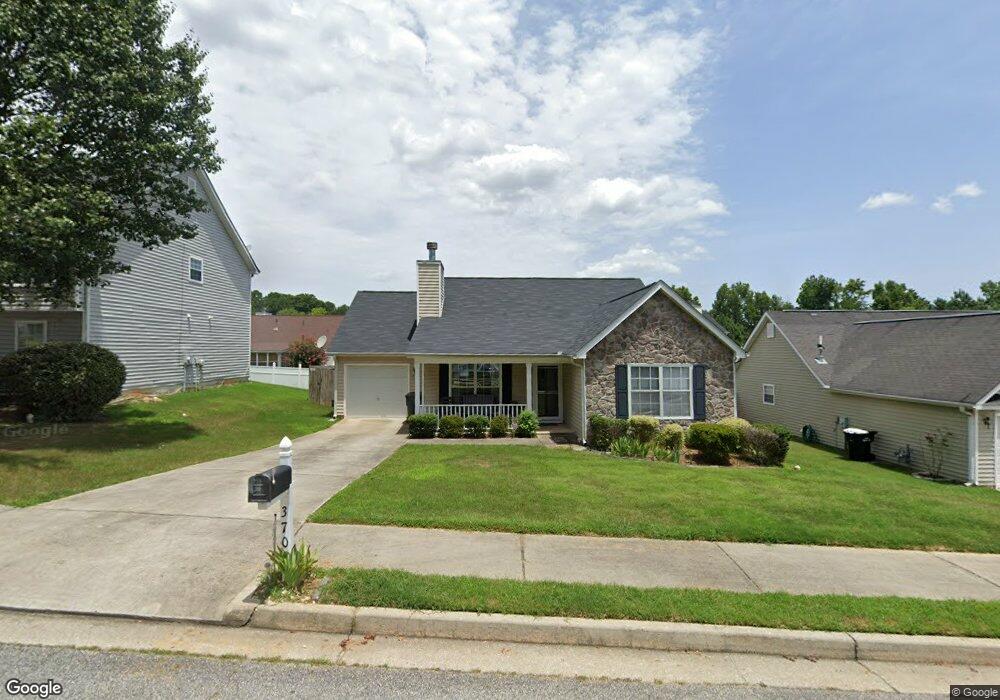
3708 Pointe Cir Fairburn, GA 30213
Estimated Value: $238,000 - $256,000
3
Beds
2
Baths
1,572
Sq Ft
$159/Sq Ft
Est. Value
About This Home
This home is located at 3708 Pointe Cir, Fairburn, GA 30213 and is currently estimated at $250,577, approximately $159 per square foot. 3708 Pointe Cir is a home located in Fulton County with nearby schools including Campbell Elementary School, Bear Creek Middle School, and Creekside High School.
Ownership History
Date
Name
Owned For
Owner Type
Purchase Details
Closed on
Mar 11, 2024
Sold by
Marshall Darnell
Bought by
Armm Asset Co 2 Llc
Current Estimated Value
Purchase Details
Closed on
Feb 14, 2024
Sold by
Edmonds Shirley Ann
Bought by
Marshall Darnell
Purchase Details
Closed on
Jul 10, 2017
Sold by
Woods Troy
Bought by
Edmonds Shirley A
Home Financials for this Owner
Home Financials are based on the most recent Mortgage that was taken out on this home.
Original Mortgage
$127,543
Interest Rate
4.25%
Mortgage Type
FHA
Purchase Details
Closed on
Jun 27, 2002
Sold by
Knight Grp Inc
Bought by
Bennett Joy E
Home Financials for this Owner
Home Financials are based on the most recent Mortgage that was taken out on this home.
Original Mortgage
$115,066
Interest Rate
6.67%
Mortgage Type
New Conventional
Create a Home Valuation Report for This Property
The Home Valuation Report is an in-depth analysis detailing your home's value as well as a comparison with similar homes in the area
Home Values in the Area
Average Home Value in this Area
Purchase History
| Date | Buyer | Sale Price | Title Company |
|---|---|---|---|
| Armm Asset Co 2 Llc | $249,000 | -- | |
| Marshall Darnell | -- | -- | |
| Edmonds Shirley A | $129,900 | -- | |
| Bennett Joy E | $118,700 | -- |
Source: Public Records
Mortgage History
| Date | Status | Borrower | Loan Amount |
|---|---|---|---|
| Previous Owner | Edmonds Shirley A | $127,543 | |
| Previous Owner | Bennett Joy E | $115,066 |
Source: Public Records
Tax History
| Year | Tax Paid | Tax Assessment Tax Assessment Total Assessment is a certain percentage of the fair market value that is determined by local assessors to be the total taxable value of land and additions on the property. | Land | Improvement |
|---|---|---|---|---|
| 2025 | $847 | $104,080 | $30,040 | $74,040 |
| 2023 | $847 | $109,840 | $30,040 | $79,800 |
| 2022 | $2,552 | $90,400 | $14,760 | $75,640 |
| 2021 | $568 | $67,880 | $6,040 | $61,840 |
| 2020 | $1,834 | $64,960 | $11,200 | $53,760 |
| 2019 | $453 | $57,360 | $10,400 | $46,960 |
| 2018 | $416 | $51,960 | $9,400 | $42,560 |
| 2017 | $432 | $24,960 | $3,720 | $21,240 |
| 2016 | $431 | $24,960 | $3,720 | $21,240 |
| 2015 | $432 | $24,960 | $3,720 | $21,240 |
| 2014 | $434 | $24,960 | $3,720 | $21,240 |
Source: Public Records
Map
Nearby Homes
- 5077 Meadow Trace
- 8258 Champion Trail
- 7875 Bohannon Rd
- LOT 1 Bohannon Rd Unit LOT 1
- 8025 Creekwood Rd
- 0 Highway 74 N Unit 10510935
- 92 Revere Turn
- 7846 Marie Way
- 7844 Marie Way
- 7842 Marie Way
- 7840 Marie Way
- 7838 Marie Way
- 7836 Marie Way
- 7834 Marie Way
- 3144 Broadleaf Trail Unit 9
- 3144 Broadleaf Trail
- 7830 Marie Way
- 3018 Broadleaf Trail
- 0 Harris Rd Unit 10245444
- 5526 Cosimo Rd
- 3708 Pointe Cir
- 3704 Pointe Cir
- 3712 Pointe Cir
- 3609 Pointe Ct
- 3613 Pointe Ct Unit 4
- 3605 Pointe Ct
- 3716 Pointe Cir Unit 4
- 3700 Pointe Cir
- 3700 Pointe Cir
- 3700 Pointe Cir Unit 3700
- 3713 Pointe Cir
- 3709 Pointe Cir
- 3717 Pointe Cir Unit 4
- 3601 Pointe Ct Unit 4
- 3705 Pointe Cir Unit 4
- 3617 Pointe Ct
- 3721 Pointe Cir
- 3720 Pointe Cir Unit 1
- 3725 Pointe Cir Unit 4
Your Personal Tour Guide
Ask me questions while you tour the home.