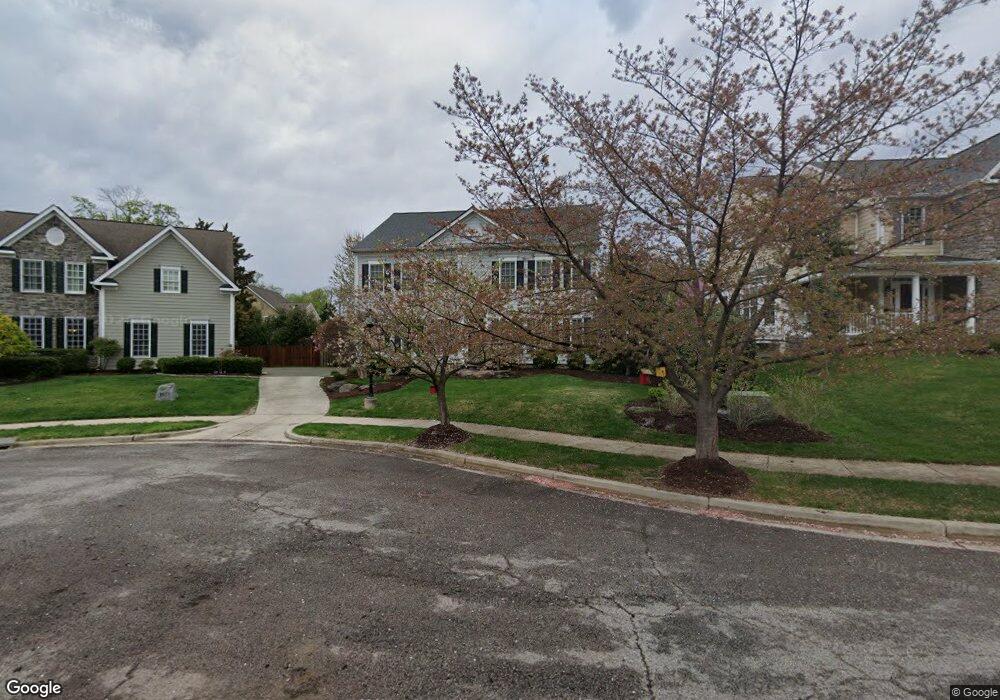
3708 Taft Ave Alexandria, VA 22304
Seminary Hill NeighborhoodEstimated Value: $1,270,000 - $1,614,000
5
Beds
5
Baths
4,200
Sq Ft
$334/Sq Ft
Est. Value
About This Home
This home is located at 3708 Taft Ave, Alexandria, VA 22304 and is currently estimated at $1,401,229, approximately $333 per square foot. 3708 Taft Ave is a home located in Alexandria City with nearby schools including Patrick Henry Elementary School, Alexandria City High School, and Fusion Academy Alexandria.
Ownership History
Date
Name
Owned For
Owner Type
Purchase Details
Closed on
Sep 26, 2024
Sold by
Reist David Gerard and Reist Kathryn Z
Bought by
David Gerard Reist Living Trust and Kathryn Z Reist Living Trust
Current Estimated Value
Purchase Details
Closed on
Jun 4, 2010
Sold by
Taft Street Llc
Bought by
Reist David G
Home Financials for this Owner
Home Financials are based on the most recent Mortgage that was taken out on this home.
Original Mortgage
$855,933
Interest Rate
5.12%
Mortgage Type
New Conventional
Purchase Details
Closed on
Jul 30, 2004
Sold by
Orizondo Saskia
Bought by
A and M 3708 Taft Avenue
Home Financials for this Owner
Home Financials are based on the most recent Mortgage that was taken out on this home.
Original Mortgage
$247,500
Interest Rate
6.2%
Mortgage Type
Construction
Create a Home Valuation Report for This Property
The Home Valuation Report is an in-depth analysis detailing your home's value as well as a comparison with similar homes in the area
Home Values in the Area
Average Home Value in this Area
Purchase History
| Date | Buyer | Sale Price | Title Company |
|---|---|---|---|
| David Gerard Reist Living Trust | -- | None Listed On Document | |
| Reist David G | $951,142 | -- | |
| A | $275,000 | -- |
Source: Public Records
Mortgage History
| Date | Status | Borrower | Loan Amount |
|---|---|---|---|
| Previous Owner | Reist David G | $855,933 | |
| Previous Owner | A | $247,500 |
Source: Public Records
Tax History Compared to Growth
Tax History
| Year | Tax Paid | Tax Assessment Tax Assessment Total Assessment is a certain percentage of the fair market value that is determined by local assessors to be the total taxable value of land and additions on the property. | Land | Improvement |
|---|---|---|---|---|
| 2025 | $12,975 | $1,114,316 | $478,000 | $636,316 |
| 2024 | $12,975 | $1,071,264 | $460,000 | $611,264 |
| 2023 | $11,891 | $1,071,264 | $460,000 | $611,264 |
| 2022 | $11,335 | $1,021,202 | $440,000 | $581,202 |
| 2021 | $10,746 | $968,140 | $417,000 | $551,140 |
| 2020 | $11,320 | $962,591 | $417,000 | $545,591 |
| 2019 | $10,662 | $943,499 | $408,000 | $535,499 |
| 2018 | $10,400 | $920,344 | $400,000 | $520,344 |
| 2017 | $10,318 | $913,073 | $388,500 | $524,573 |
| 2016 | $10,180 | $948,723 | $388,500 | $560,223 |
| 2015 | $9,437 | $904,759 | $370,000 | $534,759 |
| 2014 | $9,482 | $909,115 | $370,000 | $539,115 |
Source: Public Records
Map
Nearby Homes
- 132 N Early St
- 3811 Usher Ct
- 3816 Usher Ct
- 32 Carriage House Cir
- 318 N Quaker Ln
- 28 Garden Dr
- 3968 Fort Worth Ave
- 3841 Watkins Mill Dr
- 3409 Sterling Ave
- 104 Cahill Dr
- 3819 Dominion Mill Dr
- 1231 Quaker Hill Dr
- 1255 Dartmouth Ct
- 33 Underwood Place
- 115 S Ingram St
- 803 N Howard St Unit 152
- 803 N Howard St Unit 252
- 803 N Howard St Unit 254
- 3782 Elmwood Towne Way
- 3852 Elmwood Towne Way
- 3712 Taft Ave
- 3704 Taft Ave
- 107 N Donelson St
- 33 N Donelson St
- 115 N Donelson St
- 3700 Taft Ave
- 25 N Donelson St
- 3709 Taft Ave
- 19 N Donelson St
- 3705 Taft Ave
- 123 N Donelson St
- 3701 Taft Ave
- 3713 Taft Ave
- 3751 Duke St
- 3720 Taft Ave
- 3745 Duke St
- 3757 Duke St
- 3739 Duke St
- 3717 Taft Ave
- 131 N Donelson St