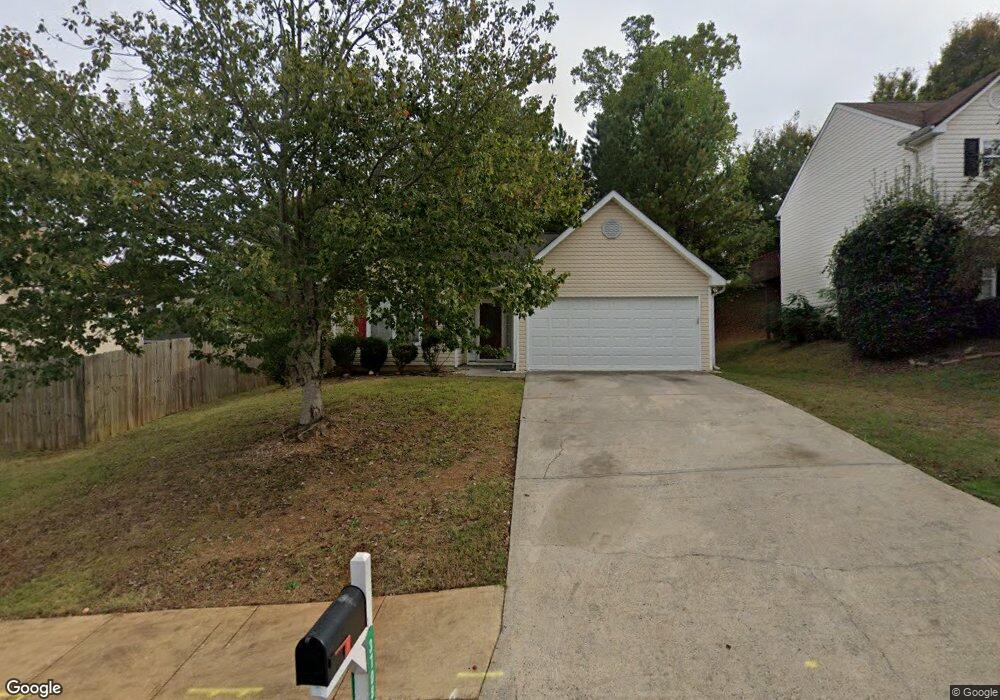
3708 Wavetree Pass NW Acworth, GA 30101
Estimated Value: $315,251 - $326,000
3
Beds
2
Baths
1,182
Sq Ft
$271/Sq Ft
Est. Value
About This Home
This home is located at 3708 Wavetree Pass NW, Acworth, GA 30101 and is currently estimated at $320,063, approximately $270 per square foot. 3708 Wavetree Pass NW is a home located in Cobb County with nearby schools including Baker Elementary School, Barber Middle School, and North Cobb High School.
Ownership History
Date
Name
Owned For
Owner Type
Purchase Details
Closed on
Jul 2, 2024
Sold by
Afful Lisa
Bought by
Lodde Aston C
Current Estimated Value
Home Financials for this Owner
Home Financials are based on the most recent Mortgage that was taken out on this home.
Original Mortgage
$324,022
Outstanding Balance
$319,823
Interest Rate
6.94%
Mortgage Type
FHA
Estimated Equity
$240
Purchase Details
Closed on
Jun 7, 2023
Sold by
Afful Emmanuel
Bought by
Afful Lisa
Purchase Details
Closed on
Jun 30, 2000
Sold by
Colon Frank and Colon Amanda D
Bought by
Afful Ammanuel
Home Financials for this Owner
Home Financials are based on the most recent Mortgage that was taken out on this home.
Original Mortgage
$83,200
Interest Rate
8.63%
Mortgage Type
New Conventional
Purchase Details
Closed on
Dec 18, 1996
Sold by
Summerfield Kennesaw Llc
Bought by
Colon Frank Amanda
Create a Home Valuation Report for This Property
The Home Valuation Report is an in-depth analysis detailing your home's value as well as a comparison with similar homes in the area
Home Values in the Area
Average Home Value in this Area
Purchase History
| Date | Buyer | Sale Price | Title Company |
|---|---|---|---|
| Lodde Aston C | $330,000 | None Listed On Document | |
| Afful Lisa | -- | None Listed On Document | |
| Afful Ammanuel | $104,000 | -- | |
| Colon Frank Amanda | $86,600 | -- |
Source: Public Records
Mortgage History
| Date | Status | Borrower | Loan Amount |
|---|---|---|---|
| Open | Lodde Aston C | $324,022 | |
| Previous Owner | Afful Ammanuel | $83,200 | |
| Closed | Colon Frank Amanda | $0 |
Source: Public Records
Tax History
| Year | Tax Paid | Tax Assessment Tax Assessment Total Assessment is a certain percentage of the fair market value that is determined by local assessors to be the total taxable value of land and additions on the property. | Land | Improvement |
|---|---|---|---|---|
| 2025 | $3,530 | $117,156 | $30,000 | $87,156 |
| 2024 | $3,219 | $117,156 | $30,000 | $87,156 |
| 2023 | $2,129 | $112,212 | $17,600 | $94,612 |
| 2022 | $2,278 | $93,320 | $17,600 | $75,720 |
| 2021 | $1,882 | $75,232 | $17,600 | $57,632 |
| 2020 | $2,038 | $67,140 | $17,600 | $49,540 |
| 2019 | $1,826 | $60,164 | $17,600 | $42,564 |
| 2018 | $1,826 | $60,164 | $17,600 | $42,564 |
| 2017 | $1,545 | $53,732 | $17,600 | $36,132 |
| 2016 | $1,286 | $44,716 | $8,000 | $36,716 |
| 2015 | $1,317 | $44,716 | $8,000 | $36,716 |
| 2014 | $922 | $31,024 | $0 | $0 |
Source: Public Records
Map
Nearby Homes
- 4080 Amberly Green NW
- 2256 Dresden Green NW
- 3712 Vineyards Lake Cir NW Unit U2
- 3735 Vineyards Lake Cir NW Unit 24
- 3733 Vineyards Lake Cir NW Unit 24
- 4003 Maple Ridge Ln NW
- 3758 Vineyards Lake Cir NW Unit 8
- 4020 Vineyards Ln NW Unit 25
- 3794 Vineyards Lake Cir NW Unit 12
- 4029 Dorchester Walk NW
- 4375 Lippencott Ln
- 3996 Verbena Dr NW
- 3998 Verbena Dr NW
- 4011 Avalon Pkwy NW
- 4034 Weeks Dr NW
- 1622 Hemburg Trace NW
- 1622 Hemburg Trace NW Unit 3
- 1500 Shiloh Place NW
- 3639 Abercorn Way NW
- 4494 Black Hills Dr NW Unit 13
- 3706 Wavetree Pass NW
- 2183 Serenity Dr NW Unit 2183
- 2183 Serenity Dr NW Unit N/A
- 2183 Serenity Dr NW
- 2181 Serenity Dr NW
- 2318 Wavetree Ln NW
- 2318 Wavetree Ln NW Unit 256
- 3708 Wavetree Overlook NW
- 2179 Serenity Dr NW Unit IV
- 3706 Wavetree Overlook NW
- 2322 Wavetree Ln NW
- 2324 Wavetree Ln NW Unit IV
- 2314 Wavetree Ln NW
- 3707 Wavetree Pass NW
- 3707 Wavetree
- 3709 Wavetree Pass NW
- 3711 Wavetree Pass NW
- 2177 Serenity Dr NW
- 3705 Wavetree Overlook NW
- 3705 Wavetree Pass NW
Your Personal Tour Guide
Ask me questions while you tour the home.