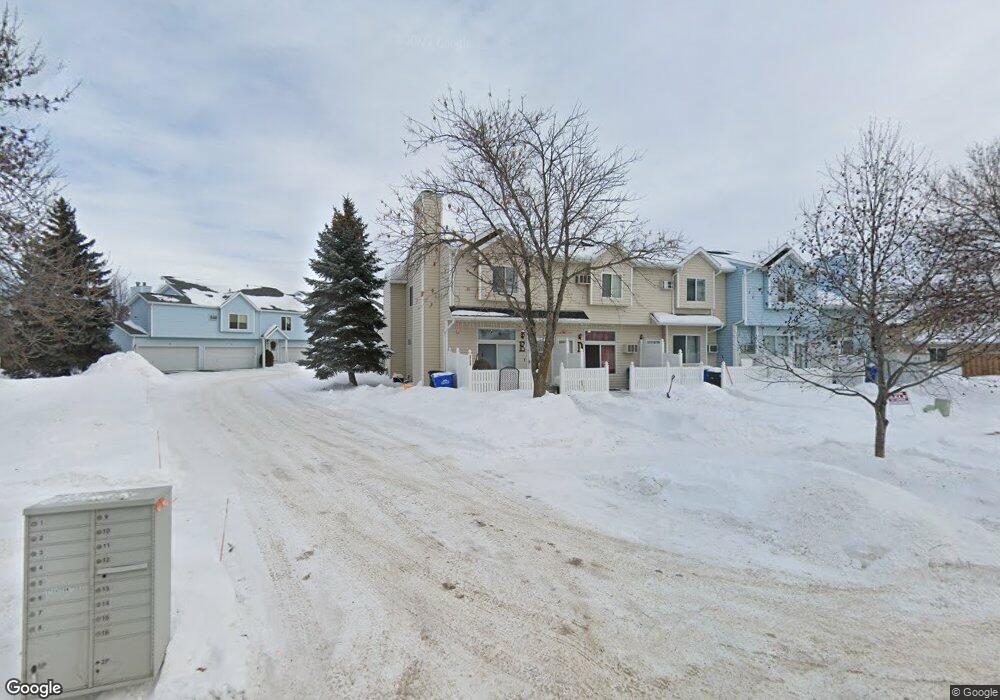
3709 10th St N Unit C Fargo, ND 58102
Trollwood NeighborhoodEstimated Value: $213,000 - $238,000
3
Beds
3
Baths
1,568
Sq Ft
$141/Sq Ft
Est. Value
About This Home
This home is located at 3709 10th St N Unit C, Fargo, ND 58102 and is currently estimated at $221,256, approximately $141 per square foot. 3709 10th St N Unit C is a home located in Cass County with nearby schools including McKinley Elementary School, Ben Franklin Middle School, and North High School.
Ownership History
Date
Name
Owned For
Owner Type
Purchase Details
Closed on
Apr 21, 2022
Sold by
Meier Brian and Kramer-Meier Linda
Bought by
Kalina Emily Jean and Kalina Kelly David
Current Estimated Value
Home Financials for this Owner
Home Financials are based on the most recent Mortgage that was taken out on this home.
Original Mortgage
$161,910
Outstanding Balance
$151,430
Interest Rate
3.85%
Mortgage Type
New Conventional
Estimated Equity
$69,826
Purchase Details
Closed on
Jun 15, 2018
Sold by
Mulske Daria J and Odegaard Daria J
Bought by
Meier Brian and Kramer Meier Linda
Purchase Details
Closed on
Sep 18, 2009
Sold by
Young Rhonda L and Young Joel
Bought by
Odegaard Daria J
Home Financials for this Owner
Home Financials are based on the most recent Mortgage that was taken out on this home.
Original Mortgage
$111,836
Interest Rate
5.55%
Mortgage Type
FHA
Create a Home Valuation Report for This Property
The Home Valuation Report is an in-depth analysis detailing your home's value as well as a comparison with similar homes in the area
Home Values in the Area
Average Home Value in this Area
Purchase History
| Date | Buyer | Sale Price | Title Company |
|---|---|---|---|
| Kalina Emily Jean | $179,900 | The Title Company | |
| Meier Brian | $159,650 | Title Co | |
| Odegaard Daria J | -- | -- |
Source: Public Records
Mortgage History
| Date | Status | Borrower | Loan Amount |
|---|---|---|---|
| Open | Kalina Emily Jean | $161,910 | |
| Previous Owner | Odegaard Daria J | $111,836 |
Source: Public Records
Tax History Compared to Growth
Tax History
| Year | Tax Paid | Tax Assessment Tax Assessment Total Assessment is a certain percentage of the fair market value that is determined by local assessors to be the total taxable value of land and additions on the property. | Land | Improvement |
|---|---|---|---|---|
| 2024 | $2,439 | $89,600 | $5,550 | $84,050 |
| 2023 | $2,313 | $85,350 | $5,550 | $79,800 |
| 2022 | $2,091 | $76,200 | $5,550 | $70,650 |
| 2021 | $1,868 | $69,250 | $5,550 | $63,700 |
| 2020 | $1,844 | $69,250 | $5,550 | $63,700 |
| 2019 | $1,846 | $69,250 | $3,300 | $65,950 |
| 2018 | $1,441 | $54,600 | $3,300 | $51,300 |
| 2017 | $1,312 | $51,050 | $3,300 | $47,750 |
| 2016 | $1,124 | $47,700 | $3,300 | $44,400 |
| 2015 | $1,199 | $47,700 | $2,250 | $45,450 |
| 2014 | $1,377 | $53,400 | $2,250 | $51,150 |
| 2013 | $1,378 | $53,400 | $2,250 | $51,150 |
Source: Public Records
Map
Nearby Homes
- 877 37th Ave N
- 1031 Gibraltor Ave
- 3222 10th St N
- 801 32nd Ave N Unit A102
- 3113 8th St N
- 916 42nd Ave N
- 4834 42nd Ave N
- 3531 1st St N
- 4408 Riverwood Dr N
- 108 32nd Ave N
- 501 Forest Ave N Unit C
- 2937 Edgewood Dr N
- 2926 Edgewood Dr N
- 2925 Edgewood Dr N
- 2902 3rd St N
- 3667 Evergreen Rd N
- 2807 Edgewood Dr N
- 2510 10th St N
- 3402 Par St N
- 3513 Par St N
- 3709 10th St N Unit E
- 3709 10th St N Unit B
- 3709 10th St N Unit A
- 3709 10th St N
- 3705 10th St N Unit D
- 3705 10th St N Unit C
- 3705 10th St N Unit B
- 3705 10th St N Unit A
- 3705 10th St N
- 3705 10th St N Unit D
- 3711 10th St N Unit F
- 3711 10th St N Unit E
- 3711 10th St N Unit D
- 3711 10th St N Unit C
- 3711 10th St N Unit B
- 3711 10th St N Unit A
- 3711 10th St N
- 3707 10th St N Unit F
- 3707 10th St N Unit E
- 3707 10th St N Unit D