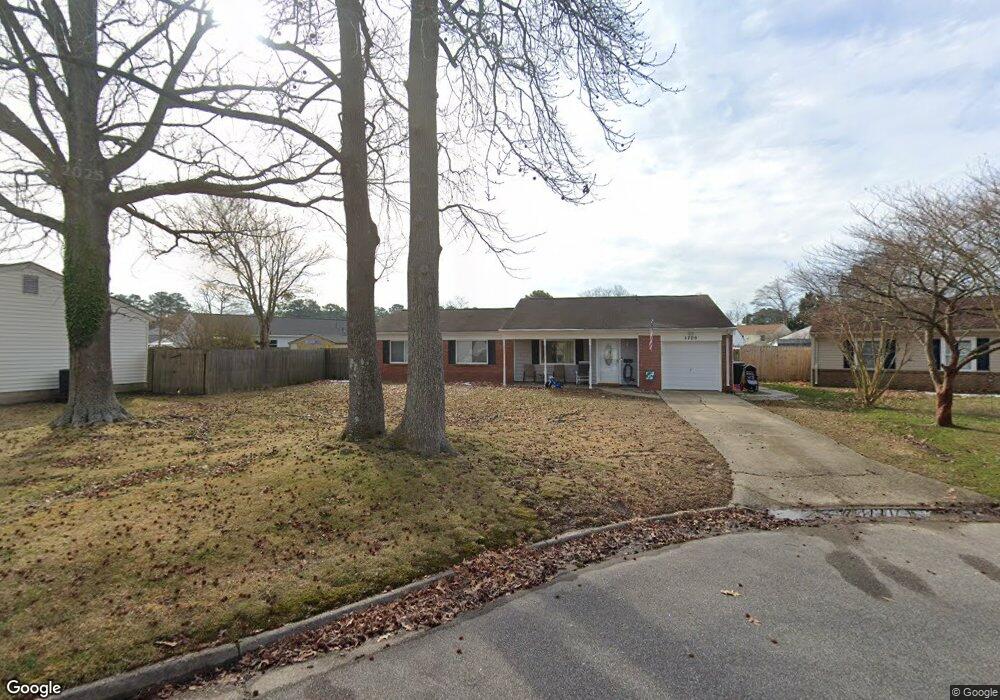
3709 Appalachian Ct Virginia Beach, VA 23452
Larkspur NeighborhoodEstimated Value: $372,156 - $429,000
3
Beds
2
Baths
1,426
Sq Ft
$281/Sq Ft
Est. Value
About This Home
This home is located at 3709 Appalachian Ct, Virginia Beach, VA 23452 and is currently estimated at $401,289, approximately $281 per square foot. 3709 Appalachian Ct is a home located in Virginia Beach City with nearby schools including Windsor Woods Elementary School, Independence Middle School, and Princess Anne High School.
Ownership History
Date
Name
Owned For
Owner Type
Purchase Details
Closed on
Aug 10, 2017
Sold by
Sprague Christopher M and Sprague Aubrey A
Bought by
Lohr Tyler J
Current Estimated Value
Home Financials for this Owner
Home Financials are based on the most recent Mortgage that was taken out on this home.
Original Mortgage
$240,950
Outstanding Balance
$201,433
Interest Rate
4.03%
Mortgage Type
VA
Estimated Equity
$199,856
Purchase Details
Closed on
Apr 8, 2010
Sold by
B And B Remoldeling Llc
Bought by
Sprague Christopher M
Home Financials for this Owner
Home Financials are based on the most recent Mortgage that was taken out on this home.
Original Mortgage
$225,834
Interest Rate
5.25%
Mortgage Type
FHA
Purchase Details
Closed on
Aug 18, 2009
Sold by
Benz Joan C
Bought by
B And B Remodeling Llc
Create a Home Valuation Report for This Property
The Home Valuation Report is an in-depth analysis detailing your home's value as well as a comparison with similar homes in the area
Home Values in the Area
Average Home Value in this Area
Purchase History
| Date | Buyer | Sale Price | Title Company |
|---|---|---|---|
| Lohr Tyler J | $235,900 | Fidelity National Title | |
| Sprague Christopher M | $230,000 | -- | |
| B And B Remodeling Llc | $125,000 | -- |
Source: Public Records
Mortgage History
| Date | Status | Borrower | Loan Amount |
|---|---|---|---|
| Open | Lohr Tyler J | $240,950 | |
| Previous Owner | Sprague Christopher M | $225,834 |
Source: Public Records
Tax History Compared to Growth
Tax History
| Year | Tax Paid | Tax Assessment Tax Assessment Total Assessment is a certain percentage of the fair market value that is determined by local assessors to be the total taxable value of land and additions on the property. | Land | Improvement |
|---|---|---|---|---|
| 2025 | $2,920 | $308,600 | $135,000 | $173,600 |
| 2024 | $2,920 | $301,000 | $135,000 | $166,000 |
| 2023 | $2,785 | $281,300 | $120,000 | $161,300 |
| 2022 | $2,587 | $261,300 | $100,000 | $161,300 |
| 2021 | $2,251 | $227,400 | $80,400 | $147,000 |
| 2020 | $2,244 | $220,500 | $80,400 | $140,100 |
| 2019 | $2,210 | $211,100 | $80,400 | $130,700 |
| 2018 | $2,116 | $211,100 | $80,400 | $130,700 |
| 2017 | $1,913 | $190,800 | $80,400 | $110,400 |
| 2016 | $1,889 | $190,800 | $80,400 | $110,400 |
| 2015 | $1,868 | $188,700 | $80,400 | $108,300 |
| 2014 | $1,756 | $193,700 | $104,400 | $89,300 |
Source: Public Records
Map
Nearby Homes
- 3717 Starlighter Dr
- 3752 Kings Point Arch
- 3549 Silina Dr
- 3509 Melinda Place
- 420 Kings Point Ct
- 3705 Kings Point Cir
- 3549 Barry St
- 224 Cassady Ave
- 149 Paladin Dr
- 3416 Victoria Dr
- 3816 Old Forge Rd
- 3828 Concord Bridge Rd
- 3516 Maverick St
- 3909 W Colonial Pkwy
- 3528 Hilber St
- 200 Victoria Dr
- 3908 Brentwood Crescent
- 174 Thalia Trace Dr
- 412 Duplin St
- 3902 Thalia Trace Ct
- 3713 Appalachian Ct
- 213 N Donnawood Dr
- 3704 Shenandoah Ct
- 3701 Appalachian Ct
- 3717 Appalachian Ct
- 3708 Shenandoah Ct
- 3700 Shenandoah Ct
- 3708 Appalachian Ct
- 3704 Appalachian Ct
- 3712 Appalachian Ct
- 3716 Appalachian Ct
- 3700 Appalachian Ct
- 236 Presidential Blvd
- 232 Presidential Blvd
- 3620 Algonquin Ct
- 3713 Shenandoah Ct
- 240 Presidential Blvd
- 212 N Donnawood Dr
- 228 Presidential Blvd
- 3709 Teakwood Dr