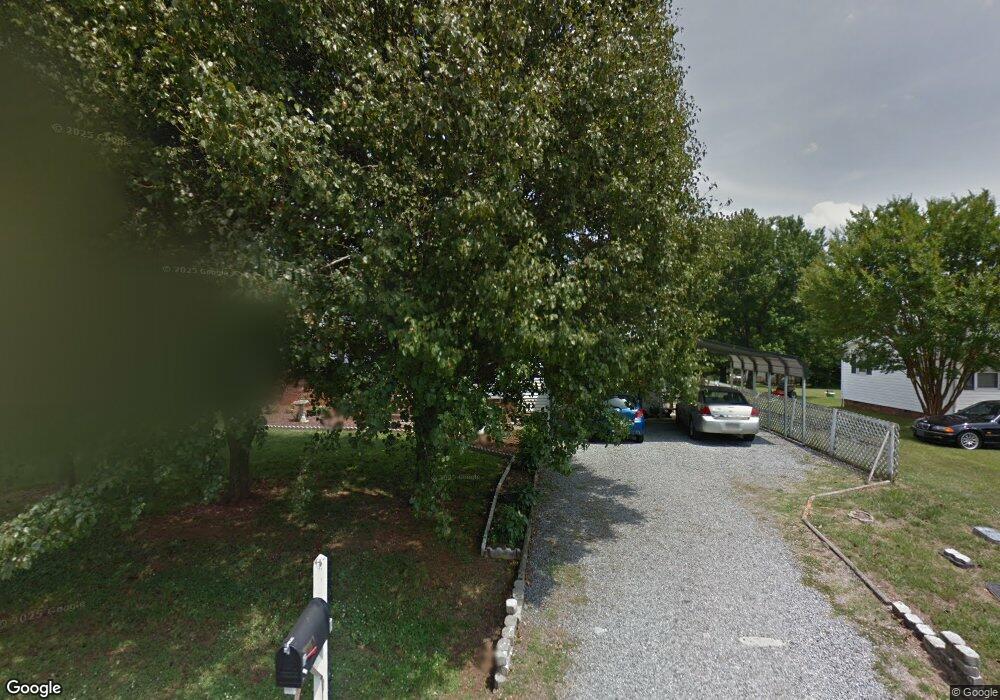
3709 Fieldcrest Cir NW Concord, NC 28027
Estimated Value: $274,000 - $289,961
3
Beds
1
Bath
1,872
Sq Ft
$150/Sq Ft
Est. Value
About This Home
This home is located at 3709 Fieldcrest Cir NW, Concord, NC 28027 and is currently estimated at $281,490, approximately $150 per square foot. 3709 Fieldcrest Cir NW is a home located in Cabarrus County with nearby schools including Weddington Hills Elementary School, Harold E. Winkler Middle School, and Cabarrus Charter Academy.
Ownership History
Date
Name
Owned For
Owner Type
Purchase Details
Closed on
May 17, 2023
Sold by
Dixon Janice C
Bought by
Boyd Gregory L and Boyd Steven R
Current Estimated Value
Purchase Details
Closed on
Mar 9, 2022
Sold by
Judy Deese
Bought by
Dixon Janice C and Harvell Linda
Purchase Details
Closed on
Aug 6, 2007
Sold by
Dixon Roscoe
Bought by
Deese Judy
Home Financials for this Owner
Home Financials are based on the most recent Mortgage that was taken out on this home.
Original Mortgage
$168,743
Interest Rate
6.63%
Mortgage Type
FHA
Purchase Details
Closed on
Aug 20, 2002
Sold by
Dixon Roscoe and Dixon Beatrice Lynn
Bought by
Dixon Roscoe and Dixon Beatrice Lynn
Home Financials for this Owner
Home Financials are based on the most recent Mortgage that was taken out on this home.
Original Mortgage
$108,600
Interest Rate
6.53%
Create a Home Valuation Report for This Property
The Home Valuation Report is an in-depth analysis detailing your home's value as well as a comparison with similar homes in the area
Home Values in the Area
Average Home Value in this Area
Purchase History
| Date | Buyer | Sale Price | Title Company |
|---|---|---|---|
| Boyd Gregory L | -- | None Listed On Document | |
| Dixon Janice C | -- | Law Office Of Amanda M Reed Pl | |
| Deese Judy | -- | Archer Land Title | |
| Dixon Roscoe | -- | -- |
Source: Public Records
Mortgage History
| Date | Status | Borrower | Loan Amount |
|---|---|---|---|
| Previous Owner | Deese Judy | $168,743 | |
| Previous Owner | Dixon Roscoe | $108,600 |
Source: Public Records
Tax History Compared to Growth
Tax History
| Year | Tax Paid | Tax Assessment Tax Assessment Total Assessment is a certain percentage of the fair market value that is determined by local assessors to be the total taxable value of land and additions on the property. | Land | Improvement |
|---|---|---|---|---|
| 2025 | $2,363 | $237,200 | $45,000 | $192,200 |
| 2024 | $2,363 | $237,200 | $45,000 | $192,200 |
| 2023 | $2,018 | $165,410 | $38,000 | $127,410 |
| 2022 | $2,020 | $165,540 | $38,000 | $127,540 |
| 2021 | $2,020 | $165,540 | $38,000 | $127,540 |
| 2020 | $2,020 | $165,540 | $38,000 | $127,540 |
| 2019 | $1,363 | $111,690 | $22,000 | $89,690 |
| 2018 | $1,340 | $111,690 | $22,000 | $89,690 |
| 2017 | $1,318 | $111,690 | $22,000 | $89,690 |
| 2016 | $782 | $110,800 | $22,000 | $88,800 |
| 2015 | $1,307 | $110,800 | $22,000 | $88,800 |
| 2014 | $1,307 | $110,800 | $22,000 | $88,800 |
Source: Public Records
Map
Nearby Homes
- 3575 Travis Ln NW
- 3331 Rock Hill Church Rd
- 3684 Lake Spring Ave NW
- 2677 Kinsley Ave NW
- 1255 Giverny Ct NW
- 1252 Giverny Ct NW
- 458 Allen Dr NW
- 456 Allen Dr NW
- 1246 Greenside Dr NW
- 4058 Sagemont Dr NW
- 3600 Still Oaks Ct NW
- 533 Montgrove Place NW
- 2676 Sunberry Ln NW
- 2695 Jameson Dr NW
- 3275 Vista Place NW
- 518 Wellbourne Ct NW
- 2566 Roswell Ct NW
- 2971 Alveston Dr Unit 29
- 2671 Torrington Ln NW
- Arlington Plan at Red Hill
- 3705 Fieldcrest Cir NW
- 3715 Fieldcrest Cir NW
- 3657 Fieldcrest Cir NW
- 3659 Fieldcrest Cir NW
- 3719 Fieldcrest Cir NW
- 710 Primrose Ln NW
- 3710 Fieldcrest Cir NW
- 3714 Fieldcrest Cir NW
- 3706 Fieldcrest Cir NW
- 714 Primrose Ln NW
- 704 Primrose Ln NW
- 3723 Fieldcrest Cir NW
- 660 Primrose Ln NW
- 3718 Fieldcrest Cir NW
- 3664 Fieldcrest Cir NW
- 3702 Fieldcrest Cir NW
- 718 Primrose Ln NW
- 3722 Fieldcrest Cir NW
- 612 Primrose Ln NW
- 3672 Fieldcrest Cir NW