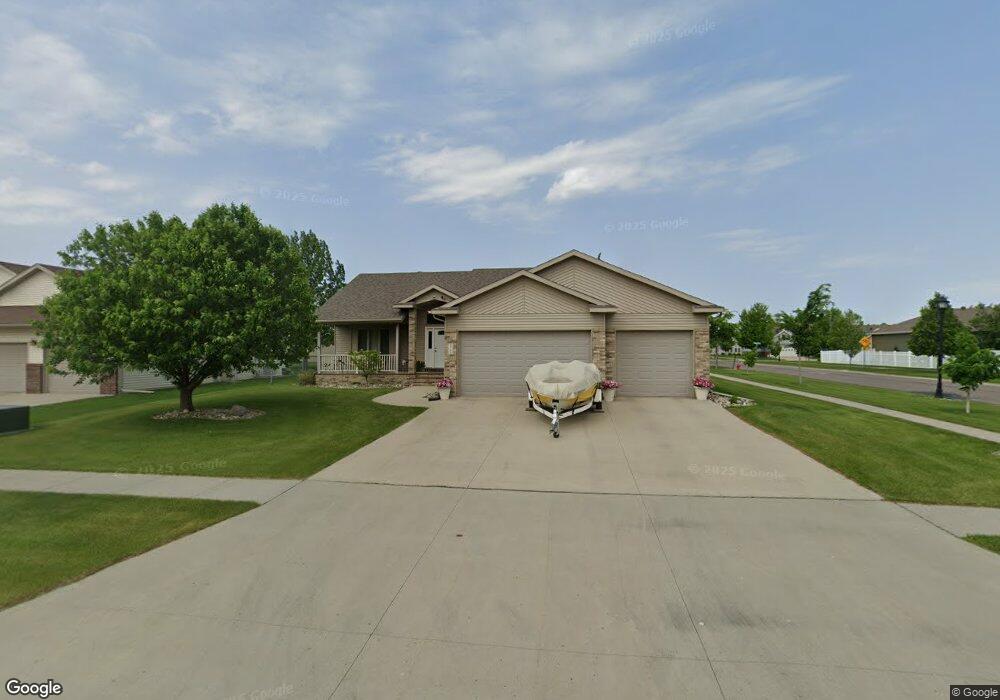
3709 Fillmore St S Fargo, ND 58104
Pointe West NeighborhoodEstimated Value: $439,000 - $520,658
4
Beds
3
Baths
1,720
Sq Ft
$284/Sq Ft
Est. Value
About This Home
This home is located at 3709 Fillmore St S, Fargo, ND 58104 and is currently estimated at $488,415, approximately $283 per square foot. 3709 Fillmore St S is a home located in Cass County with nearby schools including Kennedy Elementary School, Discovery Middle School, and Fargo Davies High School.
Ownership History
Date
Name
Owned For
Owner Type
Purchase Details
Closed on
Aug 7, 2009
Sold by
Just Bruce A
Bought by
Stoa Daniel P and Stoa Sherry K
Current Estimated Value
Home Financials for this Owner
Home Financials are based on the most recent Mortgage that was taken out on this home.
Original Mortgage
$240,000
Outstanding Balance
$157,674
Interest Rate
5.36%
Mortgage Type
New Conventional
Estimated Equity
$330,741
Purchase Details
Closed on
Oct 25, 2007
Sold by
Sdb Construction Inc
Bought by
Just Bruce A
Home Financials for this Owner
Home Financials are based on the most recent Mortgage that was taken out on this home.
Original Mortgage
$199,920
Interest Rate
6.33%
Mortgage Type
New Conventional
Purchase Details
Closed on
Oct 24, 2007
Sold by
Matrix Properties Corp
Bought by
Sdb Construction Inc
Home Financials for this Owner
Home Financials are based on the most recent Mortgage that was taken out on this home.
Original Mortgage
$199,920
Interest Rate
6.33%
Mortgage Type
New Conventional
Create a Home Valuation Report for This Property
The Home Valuation Report is an in-depth analysis detailing your home's value as well as a comparison with similar homes in the area
Home Values in the Area
Average Home Value in this Area
Purchase History
| Date | Buyer | Sale Price | Title Company |
|---|---|---|---|
| Stoa Daniel P | -- | -- | |
| Just Bruce A | -- | -- | |
| Sdb Construction Inc | -- | -- |
Source: Public Records
Mortgage History
| Date | Status | Borrower | Loan Amount |
|---|---|---|---|
| Open | Stoa Daniel P | $240,000 | |
| Previous Owner | Just Bruce A | $199,920 |
Source: Public Records
Tax History Compared to Growth
Tax History
| Year | Tax Paid | Tax Assessment Tax Assessment Total Assessment is a certain percentage of the fair market value that is determined by local assessors to be the total taxable value of land and additions on the property. | Land | Improvement |
|---|---|---|---|---|
| 2024 | $7,891 | $239,700 | $36,700 | $203,000 |
| 2023 | $8,231 | $236,050 | $26,800 | $209,250 |
| 2022 | $7,764 | $214,600 | $26,800 | $187,800 |
| 2021 | $7,512 | $207,350 | $26,800 | $180,550 |
| 2020 | $7,111 | $193,800 | $26,800 | $167,000 |
| 2019 | $7,117 | $193,800 | $16,750 | $177,050 |
| 2018 | $7,041 | $193,800 | $16,750 | $177,050 |
| 2017 | $6,598 | $178,400 | $16,750 | $161,650 |
| 2016 | $5,837 | $162,200 | $16,750 | $145,450 |
| 2015 | $6,079 | $162,200 | $11,400 | $150,800 |
| 2014 | $5,612 | $141,250 | $11,400 | $129,850 |
| 2013 | $5,456 | $134,500 | $11,400 | $123,100 |
Source: Public Records
Map
Nearby Homes
- 4306 39th Ave S
- 4293 39 1 2 Ave S
- 4318 39 1 2 Ave S
- 4276 39 1 2 Ave S
- 4274 39 1 2 Ave S
- 3608 Pierce St S
- 4245 Coventry Dr S
- 4216 34th Ave S
- 4176 Arthur Dr
- 4168 Arthur Dr
- 4150 Arthur Dr
- 4106 Arthur Dr
- 3337 Monroe St S
- 3630 Decorah Way S
- 3624 Decorah Way
- 3606 Decorah Way S
- 3612 Decorah Way S
- 4824 Decorah Way S
- 1665 3-Stall Plan at The Residence at Valley View Estates
- 4801 Decorah Way S
- 3725 Fillmore St S
- 3699 Fillmore St S
- 3743 Fillmore St S
- 4312 37th Ave S
- 3702 Fillmore St S
- 3728 Fillmore St S
- 3696 Pierce St S
- 3692 Fillmore St S
- 3750 Fillmore St S
- 3759 Fillmore St S
- 3689 Fillmore St S
- 3688 Fillmore St S
- 3688 Pierce St S
- 4318 37th Ave S
- 3772 Fillmore St S
- 3681 Fillmore St S
- 3713 Taylor St S
- 3735 Taylor St S
- 3682 Fillmore St S
- 3775 Fillmore St S