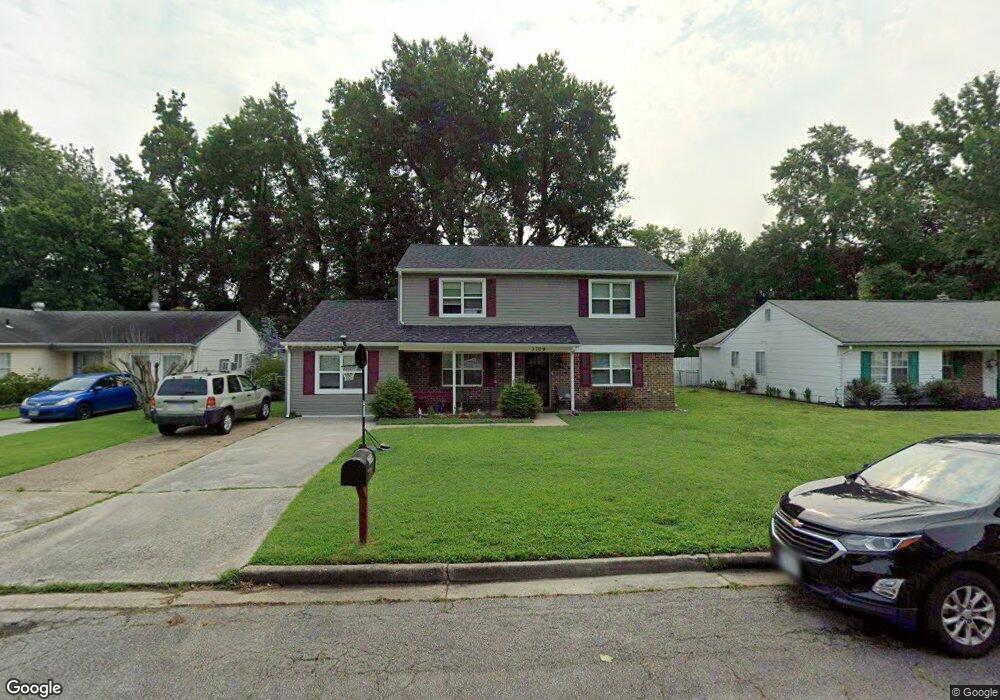
3709 Pinebark Rd Portsmouth, VA 23703
Churchland NeighborhoodEstimated Value: $308,000 - $357,000
5
Beds
3
Baths
2,011
Sq Ft
$167/Sq Ft
Est. Value
About This Home
This home is located at 3709 Pinebark Rd, Portsmouth, VA 23703 and is currently estimated at $335,148, approximately $166 per square foot. 3709 Pinebark Rd is a home located in Portsmouth City with nearby schools including Churchland Primary/Intermediate School, Churchland Middle School, and Churchland High School.
Ownership History
Date
Name
Owned For
Owner Type
Purchase Details
Closed on
Aug 23, 2017
Sold by
Cedar Homes Llc A Virginia Limited Liabi
Bought by
Lang Huner R and Lang Mary L
Current Estimated Value
Home Financials for this Owner
Home Financials are based on the most recent Mortgage that was taken out on this home.
Original Mortgage
$211,765
Outstanding Balance
$176,614
Interest Rate
4.03%
Mortgage Type
VA
Estimated Equity
$158,534
Purchase Details
Closed on
May 1, 2017
Sold by
Wells Fargo Bank Na As Trustee For Carri
Bought by
Cedar Homes Llc A Virginia Limited Liabi
Purchase Details
Closed on
Jan 6, 2016
Sold by
Samuel I White Pc A Professional Corpora and Chaplin Kathy Deniece
Bought by
Wells Fargo Bank Na As Trustee and Carrington Mortgage Loan Trust Series 20
Purchase Details
Closed on
Jul 26, 2002
Sold by
Scott Phillip D
Bought by
Chaplin Kathy
Home Financials for this Owner
Home Financials are based on the most recent Mortgage that was taken out on this home.
Original Mortgage
$108,120
Interest Rate
6.64%
Create a Home Valuation Report for This Property
The Home Valuation Report is an in-depth analysis detailing your home's value as well as a comparison with similar homes in the area
Home Values in the Area
Average Home Value in this Area
Purchase History
| Date | Buyer | Sale Price | Title Company |
|---|---|---|---|
| Lang Huner R | $205,000 | Attorney | |
| Cedar Homes Llc A Virginia Limited Liabi | $106,000 | Attorney | |
| Wells Fargo Bank Na As Trustee | $140,000 | None Available | |
| Chaplin Kathy | $106,000 | -- |
Source: Public Records
Mortgage History
| Date | Status | Borrower | Loan Amount |
|---|---|---|---|
| Open | Lang Huner R | $211,765 | |
| Previous Owner | Chaplin Kathy | $108,120 |
Source: Public Records
Tax History Compared to Growth
Tax History
| Year | Tax Paid | Tax Assessment Tax Assessment Total Assessment is a certain percentage of the fair market value that is determined by local assessors to be the total taxable value of land and additions on the property. | Land | Improvement |
|---|---|---|---|---|
| 2025 | $3,871 | $302,340 | $75,600 | $226,740 |
| 2024 | $3,871 | $300,800 | $75,600 | $225,200 |
| 2023 | $3,394 | $271,490 | $75,600 | $195,890 |
| 2022 | $3,326 | $255,810 | $63,000 | $192,810 |
| 2021 | $2,910 | $223,830 | $46,450 | $177,380 |
| 2020 | $2,781 | $213,910 | $44,240 | $169,670 |
| 2019 | $2,741 | $210,820 | $44,240 | $166,580 |
| 2018 | $2,681 | $206,200 | $44,240 | $161,960 |
| 2017 | $2,299 | $198,480 | $44,240 | $154,240 |
| 2016 | $2,299 | $176,840 | $44,240 | $132,600 |
| 2015 | $2,299 | $176,840 | $44,240 | $132,600 |
| 2014 | $2,246 | $176,840 | $44,240 | $132,600 |
Source: Public Records
Map
Nearby Homes
- 3836 Old Farm Rd
- 3791 Towne Point Rd
- 3660B Towne Point Rd Unit A
- 3715 Magnolia Dr
- 3604 Pierce St
- 3817 Harvest Ct
- 6205 Dunkirk St
- 6015 Arthur Ave
- 3705 Bamboo Rd
- 3860 Sugar Creek Cir
- 3616 Bowden St
- 6002 Campbell St
- 3818 Peach Orchard Cir
- 3877 Peachtree Ln W
- 3866 Augustine Cir
- 5911 Dunkirk St
- 3913 Stateflower Ct
- 5226 Moreland St
- 8110 Lee Hall Ave
- 5806 Fawkes St
- 3713 Pinebark Rd
- 3705 Pinebark Rd
- 71 Pepperwood Place
- 73 Pepperwood Place
- 67 Pepperwood Place
- 69 Pepperwood Place
- 75 Pepperwood Place
- 77 Pepperwood Place
- 81 Pepperwood Place
- 79 Pepperwood Place
- 3701 Pinebark Rd
- 3717 Pinebark Rd
- 83 Pepperwood Place
- 85 Pepperwood Place
- 63 Pepperwood Place
- 3708 Pinebark Rd
- 61 Pepperwood Place
- 59 Pepperwood Place
- 87 Pepperwood Place
- 57 Pepperwood Place