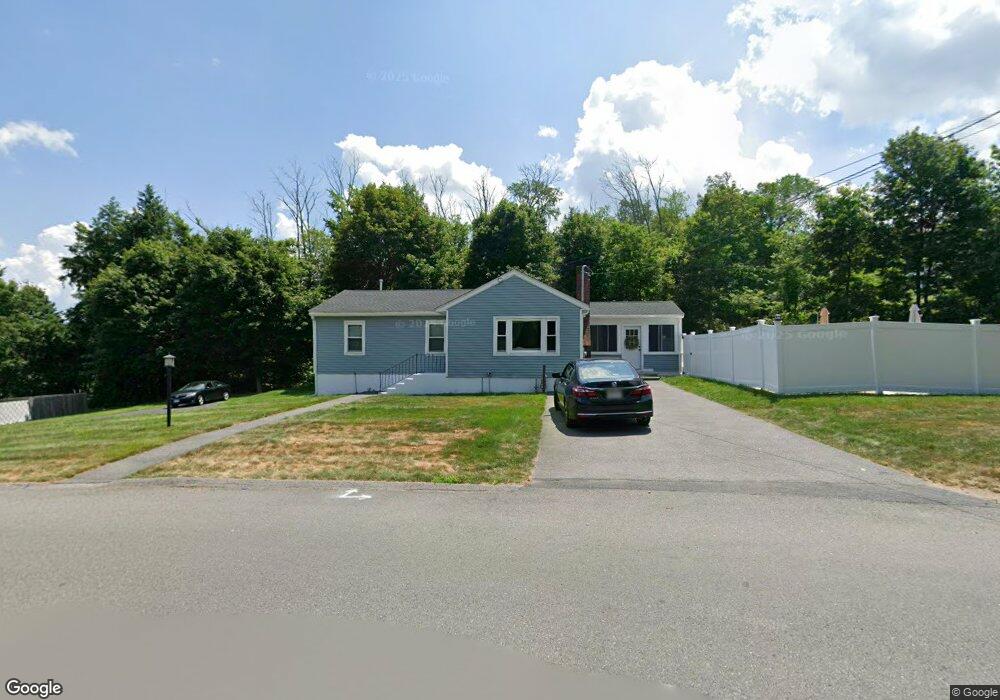
371 10th St Dracut, MA 01826
Estimated Value: $336,000 - $514,000
3
Beds
1
Bath
1,266
Sq Ft
$346/Sq Ft
Est. Value
About This Home
This home is located at 371 10th St, Dracut, MA 01826 and is currently estimated at $437,801, approximately $345 per square foot. 371 10th St is a home located in Middlesex County with nearby schools including Joseph A. Campbell Elementary School, Richardson Middle School, and Dracut Senior High School.
Ownership History
Date
Name
Owned For
Owner Type
Purchase Details
Closed on
Jun 9, 2025
Sold by
Mary Beth Conway T and Mary Conway
Bought by
Sweeney Michael H and Sweeney Mary L
Current Estimated Value
Purchase Details
Closed on
Feb 10, 2023
Sold by
Conway Mary B
Bought by
Mary Beth Conway T and Mary Conway
Purchase Details
Closed on
Dec 29, 2006
Sold by
Sweeney Grace E
Bought by
Sweeney Mary Beth
Home Financials for this Owner
Home Financials are based on the most recent Mortgage that was taken out on this home.
Original Mortgage
$70,000
Interest Rate
6.29%
Mortgage Type
Purchase Money Mortgage
Create a Home Valuation Report for This Property
The Home Valuation Report is an in-depth analysis detailing your home's value as well as a comparison with similar homes in the area
Home Values in the Area
Average Home Value in this Area
Purchase History
We collect this data history from publicly available records. To have your information removed, we recommend requesting removal directly through your county’s website.
| Date | Buyer | Sale Price | Title Company |
|---|---|---|---|
| Sweeney Michael H | $330,000 | None Available | |
| Sweeney Michael H | $330,000 | None Available | |
| Mary Beth Conway T | -- | None Available | |
| Mary Beth Conway T | -- | None Available | |
| Sweeney Mary Beth | $100,000 | -- | |
| Sweeney Mary Beth | $100,000 | -- | |
| Sweeney Mary Beth | $100,000 | -- |
Source: Public Records
Mortgage History
We collect this data history from publicly available records. To have your information removed, we recommend requesting removal directly through your county’s website.
| Date | Status | Borrower | Loan Amount |
|---|---|---|---|
| Previous Owner | Sweeney Mary Beth | $70,000 |
Source: Public Records
Tax History
| Year | Tax Paid | Tax Assessment Tax Assessment Total Assessment is a certain percentage of the fair market value that is determined by local assessors to be the total taxable value of land and additions on the property. | Land | Improvement |
|---|---|---|---|---|
| 2025 | $4,472 | $441,900 | $205,900 | $236,000 |
| 2024 | $4,499 | $430,500 | $196,100 | $234,400 |
| 2023 | $4,315 | $372,600 | $170,600 | $202,000 |
| 2022 | $4,241 | $345,100 | $155,000 | $190,100 |
| 2021 | $7,728 | $305,900 | $140,800 | $165,100 |
| 2020 | $3,837 | $287,400 | $136,600 | $150,800 |
| 2019 | $3,748 | $272,600 | $130,000 | $142,600 |
| 2018 | $3,538 | $250,200 | $130,000 | $120,200 |
| 2017 | $3,450 | $250,200 | $130,000 | $120,200 |
| 2016 | $3,320 | $223,700 | $125,000 | $98,700 |
| 2015 | $3,232 | $216,500 | $125,000 | $91,500 |
| 2014 | $3,124 | $215,600 | $125,000 | $90,600 |
Source: Public Records
Map
Nearby Homes
- 4 Hazelwood Ave Unit 12
- 185 18th St
- 337 Beacon St
- Lot 11 Christian St
- Lot 12 Christian St
- Lot 9 Christian St
- Lot 10 Christian St
- 71 Brook St
- 105 Salisbury St
- 34 E 6th St
- 43 12th St
- 81 Reservoir St
- 96 Fremont St
- Lots 1-12 Christian Hill Dev
- 23 18th St
- 51 Willard St
- 1 19th St Unit 3
- 82 Christian St
- 261 3rd St
- 63-65 Sixth St
Your Personal Tour Guide
Ask me questions while you tour the home.