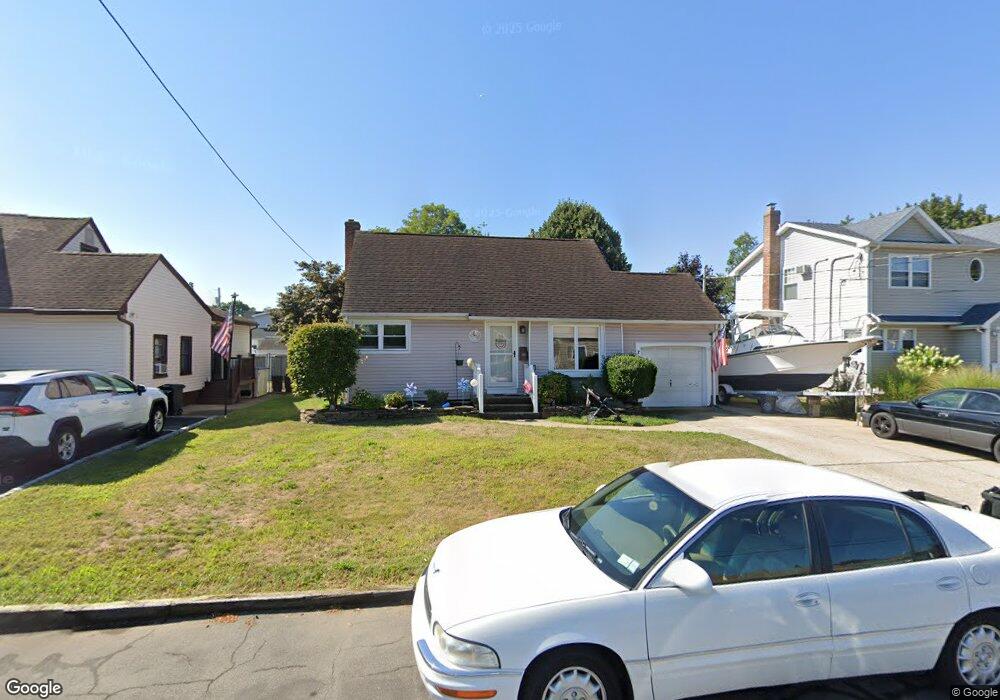
371 31st St Lindenhurst, NY 11757
Estimated Value: $550,000 - $611,000
4
Beds
1
Bath
1,168
Sq Ft
$503/Sq Ft
Est. Value
About This Home
This home is located at 371 31st St, Lindenhurst, NY 11757 and is currently estimated at $587,880, approximately $503 per square foot. 371 31st St is a home located in Suffolk County with nearby schools including Albany Avenue Elementary School, Lindenhurst Middle School, and Lindenhurst Senior High School.
Ownership History
Date
Name
Owned For
Owner Type
Purchase Details
Closed on
Sep 22, 2014
Sold by
Kret Sean W and Kret Diane
Bought by
Stankunis Joseph T
Current Estimated Value
Home Financials for this Owner
Home Financials are based on the most recent Mortgage that was taken out on this home.
Original Mortgage
$264,195
Outstanding Balance
$202,034
Interest Rate
4.11%
Mortgage Type
New Conventional
Estimated Equity
$385,846
Purchase Details
Closed on
Jan 9, 2004
Sold by
Adams Robert A
Bought by
Kret Sean W and Domine Diane M
Home Financials for this Owner
Home Financials are based on the most recent Mortgage that was taken out on this home.
Original Mortgage
$220,000
Interest Rate
5.82%
Mortgage Type
Purchase Money Mortgage
Purchase Details
Closed on
Jan 13, 1997
Sold by
Olsen Kirk and Olsen Mary E
Bought by
Adams Robert A
Create a Home Valuation Report for This Property
The Home Valuation Report is an in-depth analysis detailing your home's value as well as a comparison with similar homes in the area
Home Values in the Area
Average Home Value in this Area
Purchase History
| Date | Buyer | Sale Price | Title Company |
|---|---|---|---|
| Stankunis Joseph T | $278,100 | -- | |
| Kret Sean W | $275,000 | Seaport Title | |
| Adams Robert A | $129,500 | First American Title Ins Co |
Source: Public Records
Mortgage History
| Date | Status | Borrower | Loan Amount |
|---|---|---|---|
| Open | Stankunis Joseph T | $264,195 | |
| Previous Owner | Kret Sean W | $220,000 | |
| Previous Owner | Kret Sean W | $27,500 |
Source: Public Records
Tax History Compared to Growth
Tax History
| Year | Tax Paid | Tax Assessment Tax Assessment Total Assessment is a certain percentage of the fair market value that is determined by local assessors to be the total taxable value of land and additions on the property. | Land | Improvement |
|---|---|---|---|---|
| 2024 | $8,993 | $2,380 | $230 | $2,150 |
| 2023 | $8,040 | $2,380 | $230 | $2,150 |
| 2022 | $7,204 | $2,380 | $230 | $2,150 |
| 2021 | $7,204 | $2,380 | $230 | $2,150 |
| 2020 | $7,499 | $2,380 | $230 | $2,150 |
| 2019 | $8,345 | $0 | $0 | $0 |
| 2018 | $7,170 | $2,380 | $230 | $2,150 |
| 2017 | $7,170 | $2,380 | $230 | $2,150 |
| 2016 | $7,182 | $2,380 | $230 | $2,150 |
| 2015 | -- | $2,380 | $230 | $2,150 |
| 2014 | -- | $2,380 | $230 | $2,150 |
Source: Public Records
Map
Nearby Homes