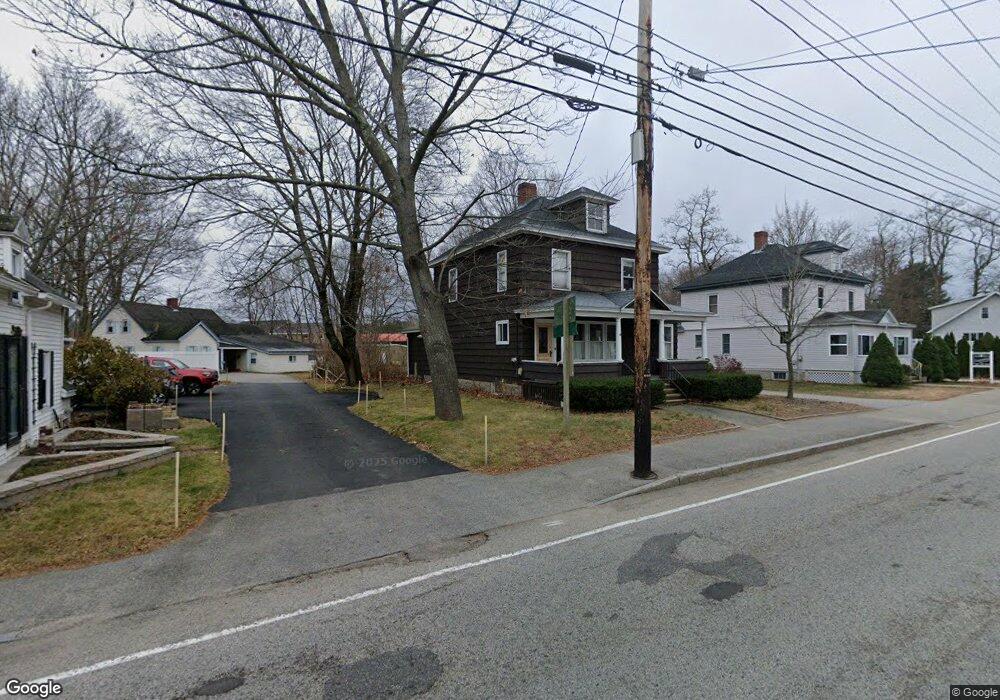
371 Alfred St Biddeford, ME 04005
Estimated Value: $399,000 - $443,000
4
Beds
2
Baths
1,759
Sq Ft
$235/Sq Ft
Est. Value
About This Home
This home is located at 371 Alfred St, Biddeford, ME 04005 and is currently estimated at $413,567, approximately $235 per square foot. 371 Alfred St is a home located in York County with nearby schools including John F Kennedy Memorial School, Biddeford Primary School, and Biddeford Intermediate School.
Ownership History
Date
Name
Owned For
Owner Type
Purchase Details
Closed on
Apr 3, 2023
Sold by
Butler Richard W and Butler Shari M
Bought by
Richard W Butler Ret
Current Estimated Value
Purchase Details
Closed on
Jul 15, 2011
Sold by
Maxwell Mary T
Bought by
Butler Shari M and Butler Richard W
Home Financials for this Owner
Home Financials are based on the most recent Mortgage that was taken out on this home.
Original Mortgage
$180,000
Interest Rate
4.58%
Mortgage Type
Purchase Money Mortgage
Create a Home Valuation Report for This Property
The Home Valuation Report is an in-depth analysis detailing your home's value as well as a comparison with similar homes in the area
Home Values in the Area
Average Home Value in this Area
Purchase History
| Date | Buyer | Sale Price | Title Company |
|---|---|---|---|
| Richard W Butler Ret | -- | None Available | |
| Butler Shari M | -- | -- |
Source: Public Records
Mortgage History
| Date | Status | Borrower | Loan Amount |
|---|---|---|---|
| Previous Owner | Butler Shari M | $180,000 |
Source: Public Records
Tax History
| Year | Tax Paid | Tax Assessment Tax Assessment Total Assessment is a certain percentage of the fair market value that is determined by local assessors to be the total taxable value of land and additions on the property. | Land | Improvement |
|---|---|---|---|---|
| 2025 | $3,929 | $263,000 | $124,700 | $138,300 |
| 2024 | $3,704 | $260,500 | $124,700 | $135,800 |
| 2023 | $3,418 | $260,500 | $124,700 | $135,800 |
| 2022 | $3,218 | $196,100 | $49,200 | $146,900 |
| 2021 | $2,594 | $167,300 | $40,900 | $126,400 |
| 2020 | $2,871 | $167,700 | $49,700 | $118,000 |
| 2019 | $3,351 | $167,700 | $49,700 | $118,000 |
| 2018 | $2,926 | $167,700 | $49,700 | $118,000 |
| 2017 | $4,200 | $159,300 | $49,700 | $109,600 |
| 2016 | $3,164 | $159,300 | $49,700 | $109,600 |
| 2015 | $3,102 | $159,300 | $49,700 | $109,600 |
| 2014 | $3,025 | $159,300 | $49,700 | $109,600 |
| 2013 | -- | $177,800 | $57,400 | $120,400 |
Source: Public Records
Map
Nearby Homes
Your Personal Tour Guide
Ask me questions while you tour the home.